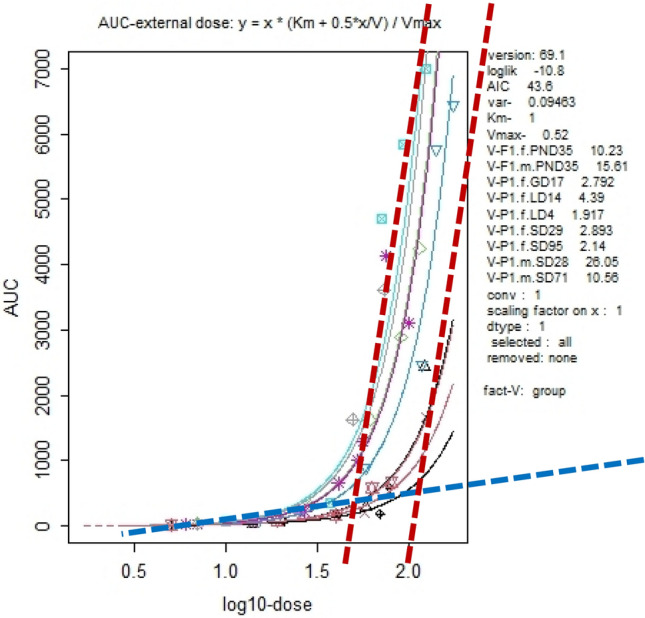
Fig. 2.

KMD Region Identified in AUC-External dose plot from Figure 8(a) of Slob et al. 2020. Figure 8 of Slob et al. 2020 showing the relationship between area under the blood concentration curve (AUC) for 2,4-D plotted against the base 10 logarithm of the dose administered to rats. The blue dashed line is an estimate of the slope of the relationship at doses below a log10-dose of approximately 1.6, across which the slope appears to be stable. Red dashed lines are estimates of the slope of the relationship in the dose range of log10-dose 1.6–2.0
