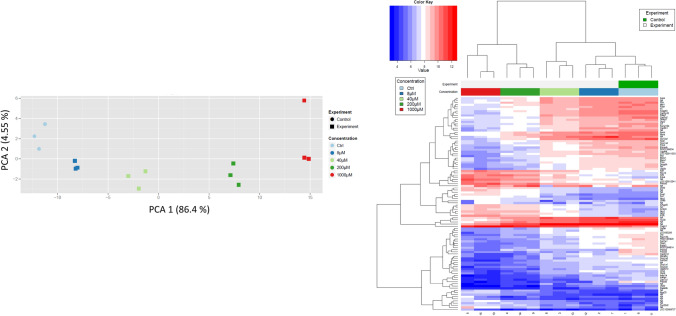
Fig. 5.
Gene array analysis of cultivated rat hepatocytes after incubation with the indicated concentrations of NVP for 24h. a Principle component analysis. PCA: principle component analysis; the percentages in brackets indicate the explained variance of the respective principle component. The three symbols per color indicate the results of three independent incubations. b Heatmap visualization of differential alterations of gene expression by NVP. The heatmap is based on the genes with the lowest adjusted p values according to the Limma t test. The colours of the heatmap indicate the relative gene regulation level above (red) or below (blue) the average for each row (color figure online)

