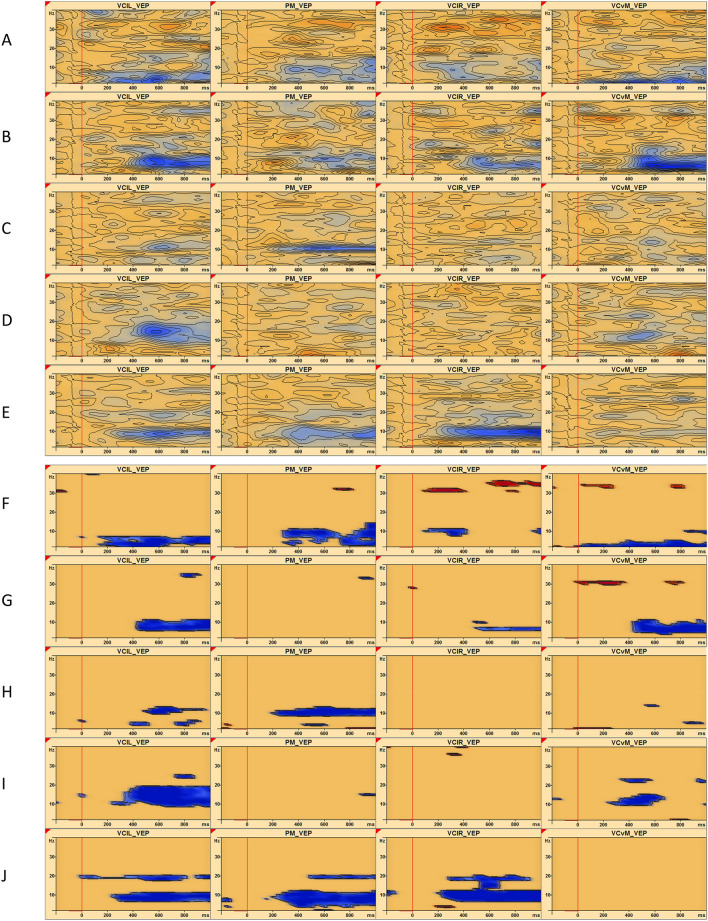
Fig. 5.
TSE plots (A, B, C, D, E) and corresponding TSE probability maps (p < 0.05; F, G, H, I, J) in sources: visual cortex lateral left (VClL), parietal midline (PM), visual cortex lateral right (VClR), and visual cortex vertical midline (VCvM), when visual motion was compared to static non-flow in five typical participants, one from each age group. From top to bottom, infant at 5 months (A, F), infant at 10 months (B, G), 6-year-old child (C, H), 12-year-old adolescent (D, I), and 26-year-old adult (E, J). Frequency (0–40 Hz) is represented on the y-axis, while latency (− 200 to 1000 ms) is on the x-axis. The vertical red line marks stimulus onset at 0 ms. Epoch is from − 200 to 800 ms, with a baseline from − 100 to 0 ms. In the TSE plots (A, B, C, D, E), blue areas indicate induced desynchronized activity (with decreased spectral amplitude), while red areas show induced synchronized activity (with increased spectral amplitude). Probability maps (F, G, H, I, J) show the areas with the largest change in activity. Compared to baseline, infants at 4–5 months showed significant theta and alpha activity (F); infants at 9–11 months showed significant alpha activity (G); 6- and 12-year-olds showed significant activity in the alpha and beta range (H, I). Finally, adults showed significant beta activity compared to baseline (J)

