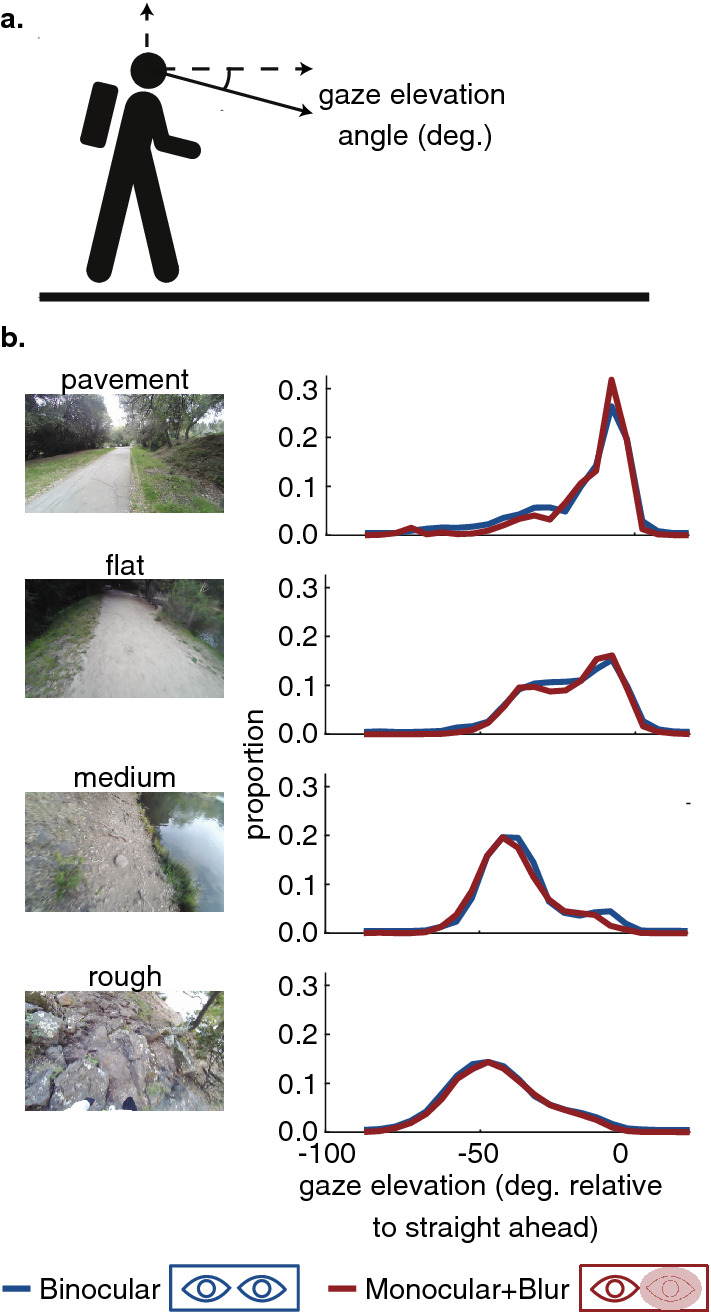
Figure 2.

Analysis of gaze distributions do not show consistent differences in gaze distributions across the binocular and blur conditions. (a) Schematic showing how the gaze elevation angle is measured (where the vertical axis is defined by gravity). (b) Distribution of gaze angles relative to the horizontal for the different terrain types. Gaze angles between and are roughly 2–3 footholds ahead. The blue line shows data for normal binocular vision and red shows the distributions in the stereo-impaired condition where one eye was blurred using a a 0.2 Bangerter foil. Data are pooled across 8 participants with stereoacuity in the normal range.
