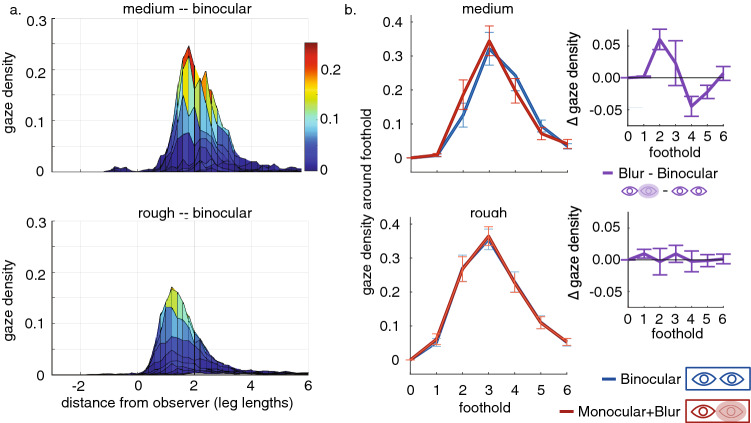
Figure 3.
An analysis of gaze densities demonstrates a bias in gaze toward the body for participants during the blur condition in the medium terrain. (a) The average gaze distribution relative to the planted foot in the binocular condition for the medium (top) and rough (bottom) terrains. This distribution is two-dimensional, though here it is viewed from a single angle that allows us to view the distribution along the path, i.e., the x-axis here corresponds to the participant’s current walking direction so that the positive direction is down the path in front of the observer. The relationship between these distributions and the summary statistics shown in b, are described in the “Methods” section and follow the methodology depicted in Fig. 6. (b) The two panels on the left show gaze density around footholds 1–6 footholds ahead, derived as described in the “Methods” section, for medium (top) and rough terrains (bottom). Note that the rough terrain shows a greater allocation of gaze to nearer footholds (specifically 2 footholds ahead). The blue and red curves show the binocular and blur conditions for the 8 normal participants. The panels on the right show the within participants differences (purple) between the binocular and blur conditions. Error bars are SEM.

