
Figure 4.
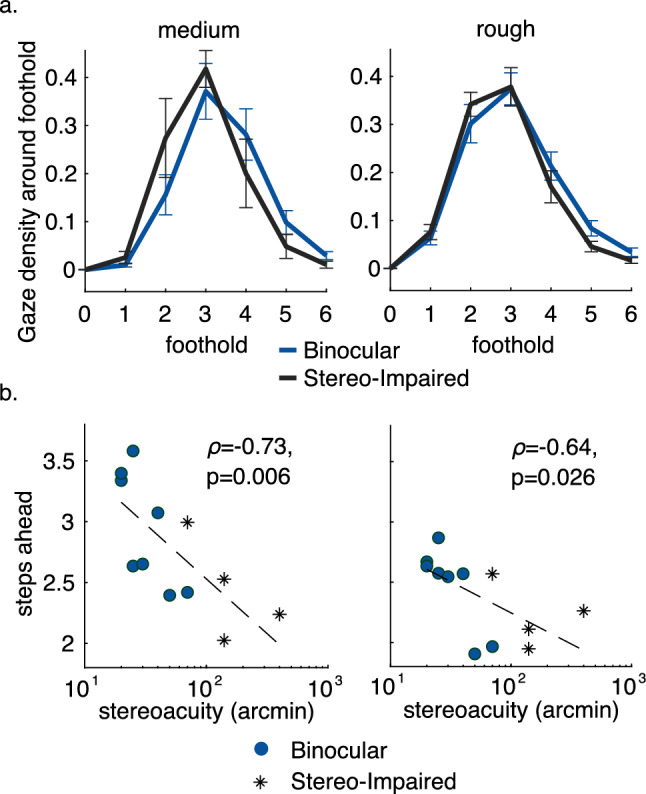
Examining the original 8 participants as well as an additional 4 participants with impairment to binocular function due to visual disorders reveals a relationship between the bias of gaze toward the body and stereoacuity. (a) Gaze density around footholds as in Fig. 3b, showing the binocular condition from the original participants and stereo-impaired participants, for medium and rough terrains. Error bars are SEM between participants. The dark blue curve shows the binocular conditions from Fig. 3b, and the light blue curve shows data for the 4 stereo-impaired participants. (b) Average footholds ahead as a function of participant stereoacuity. Average footholds ahead (y-axis) is calculated by taking the vector average of the gaze density around the foothold plotted in a (above). Stereo-acuity (x-axis) is measured as described in the Methods using the Randot metric. Correlation for the linear regression fits are shown in the Figure, with associated significance values.