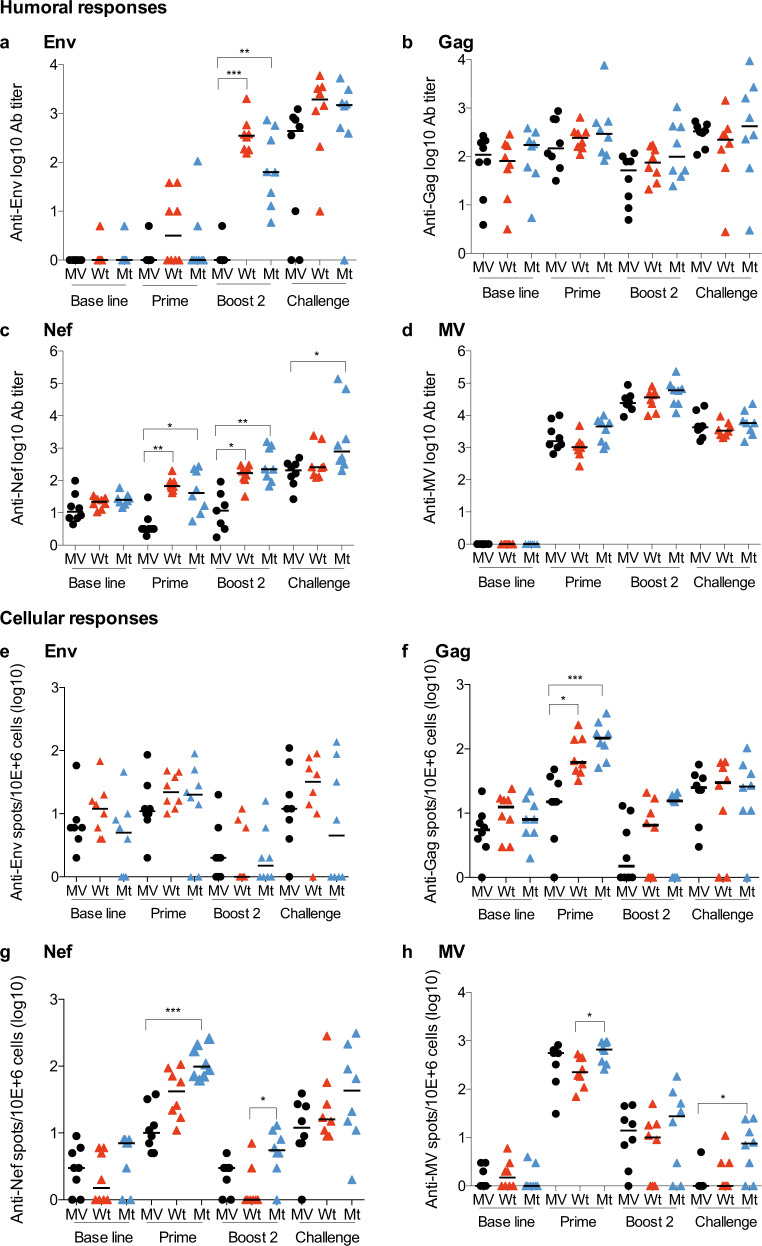
Fig. 4. Vaccine-elicited humoral and cellular immune responses.
a–d IgG antibody titers (log-endpoint ELISA titration) against (a) Env (gp120), b Gag, c Nef, d MV proteins. e–h FluoroSpot assays, IFN-γ-producing cells specific to (e) Env, f Gag, g Nef, and (h) MV proteins. P values are calculated by the Kruskal–Wallis and Dunn’s multiple comparisons tests. P values: NS > 0.05, *< 0.05, **< 0.01, ***< 0.001. Group medians are plotted as a horizontal line. Serum or PBMC was collected at the baseline (week −2), prime (week + 2), boost 2 (2 weeks post boost 2: week +31), and post challenge (2 weeks post first positive qRT-PCR for SHIV162p3 RNA in plasma).

