Figure 2.
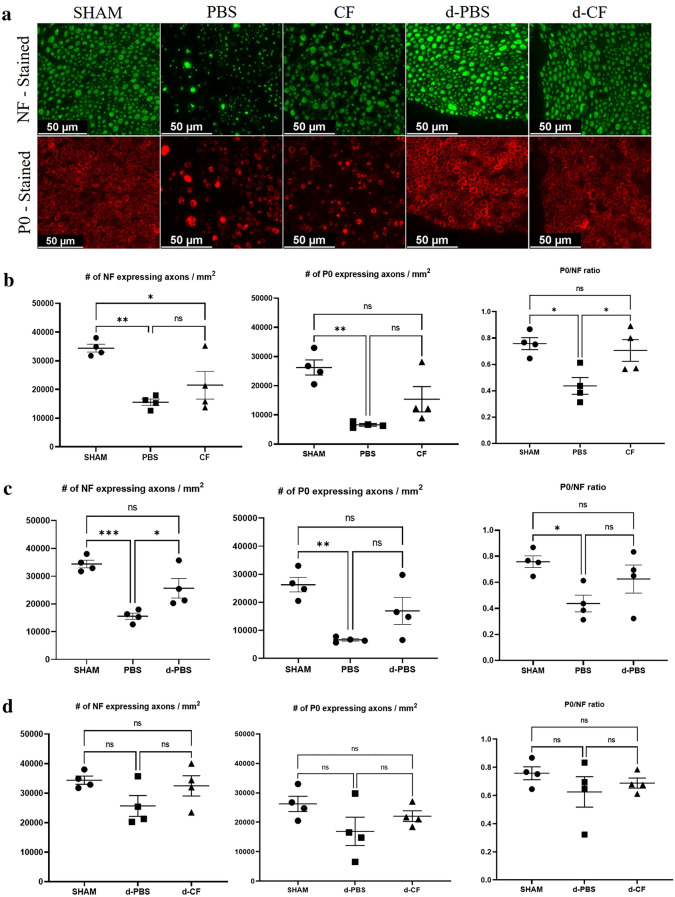
Representative cross-sectional images of the sciatic nerve upon immunofluorescence staining in the compression and decompression phase (a) (×400; scale bar = 50 μm; green, NF (neurofilament) heavy chain; red, P0 (myelin protein 0); Sham, nerves of sham-operated mice; PBS, nerves of untreated mice during compression phase; CF, nerves of mice treated with clemastine during compression phase; d-PBS, nerves of untreated mice after surgical decompression; d-CF, nerves of mice treated with clemastine after surgical decompression). Comparison of the number of NF- or P0-expressing axons/mm2 and the ratio of P0/NF-expressing axons among sham, PBS, and CF group in the compression phase (b). Comparison of these measurements among sham, PBS, and d-PBS group for evaluation of decompression effect (c). Comparison of these measurements among sham, d-PBS, and d-CF group in decompression phase (d). Error bars represent standard error of mean. One-way ANOVA with Turkey’s post-hoc test was conducted (*p < 0.05, **p < 0.01, and n = 4 animals/group).

