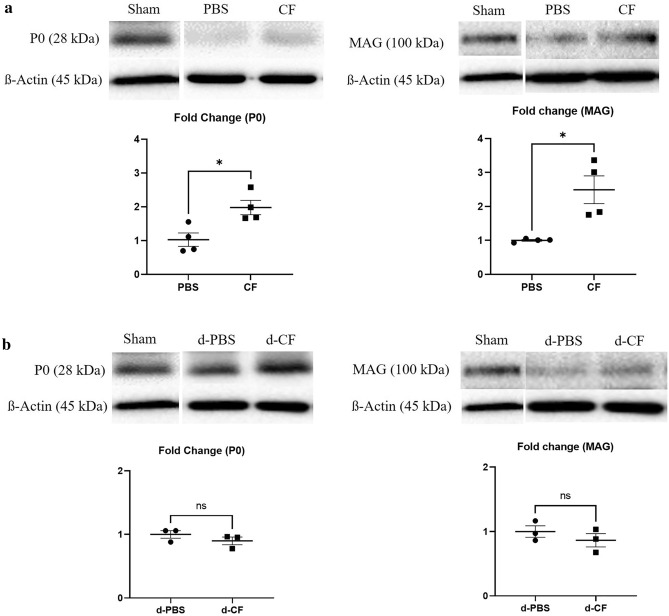
Figure 4.
Representative Western immunoblotting for P0 and MAG protein in compression phase (a) and decompression phase (b) (P0, myelin protein 0; MAG, myelin associated glycoprotein; Sham, nerves of sham-operated mice; PBS, nerves of untreated mice during compression phase; CF, nerves of mice treated with clemastine during compression phase; d-PBS, nerves of untreated mice after surgical decompression; d-CF, nerves of mice treated with clemastine after surgical decompression). Full-length Western blots are presented in Supplementary Figs. 1 and 2. Band intensity quantification of P0 and MAG of CF group as fold change of PBS group. Band intensity quantification of P0 and MAG of d-CF group as fold change of d-PBS group. ß-actin was used to normalize the intensity of the bands. Error bars represent standard error of mean. Mann–Whitney U test was conducted (*p < 0.05, and n = 3 or 4 animals per group).

