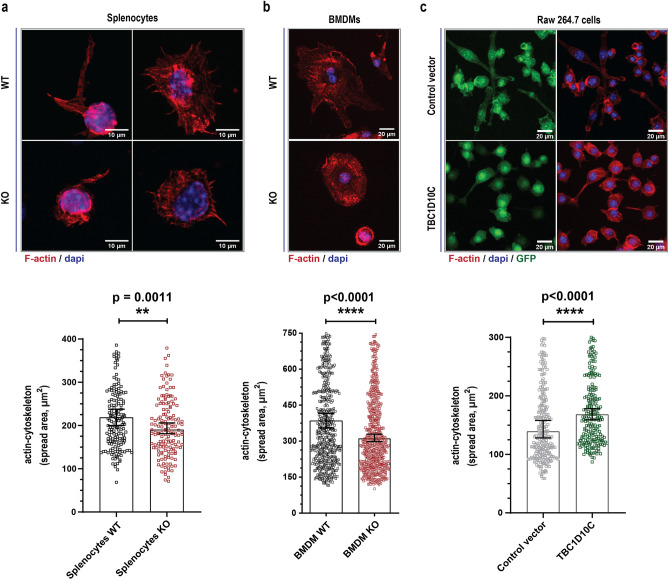
Figure 1.
Quantification of cell spreading dependent on actin-cytoskeleton. Cells were stained with phalloidin, and the area of cell spread was calculated. (a) top: Confocal images of splenocytes, bottom: corresponding spread area data from confocal images (n = 4, mice; 185 WT, 158 KO cells); (b) top: confocal images of BMDM, bottom: corresponding spread area data from confocal images (n = 7 mice; WT BMDM, 572, KO BMDM, 623); (c) top: confocal images of Raw 264.7 transfected macrophages, corresponding spread area data from confocal images (254, Control vector and 221, TBC1D10C cells; 2 independent experiments). Confocal images are presented as the sum of slice projections. Data were analyzed by the Mann–Whitney test (P < 0.05), and graphs show SEM (standard error of the mean).

