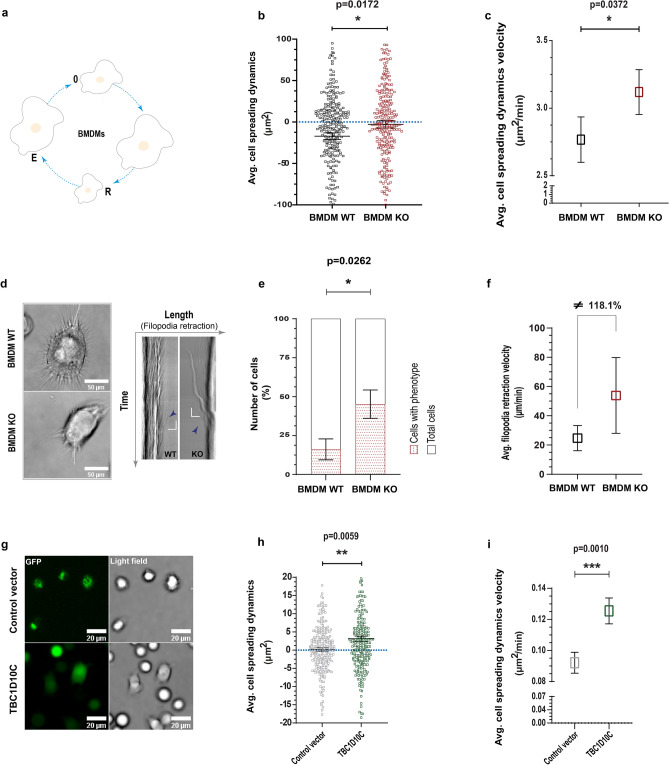
Figure 2.
Analysis of cell spreading dynamics (aspect ratio dynamics). Living macrophages were imaged by time-lapse microscopy, and spreading was determined at multiple time points. (a) Drawing of cell spreading dynamics (0, initial cellular size; R, cellular body retraction; E, cellular body spreading); (b) average data for cell spreading dynamics (negative numbers are cellular retraction and positive numbers are cellular spreading; n = 31 BMDMs); (c) average data for velocity of cell spreading dynamics; (d), left: images of living BMDMs (sum of slices projection for xyt), right: kymographs showing filopodia abrupt retraction form selected ROIs (regions of interest, are indicated in while lines) in BMDMs; (e) percentage of BMDMs showing the abrupt retraction of filopodia; (f) average velocity of abrupt retraction of filopodia; g, confocal images of living Raw 264.7 transfected macrophages (28 Control vector and 29 TBC1D10C cells; sum of slices projection for xyzt) related to data for cell spreading dynamics and corresponding velocity in (h)and (i), respectively. Data were analyzed by the Mann–Whitney test (P < 0.05), and graphs show SEM.

