Figure 3.
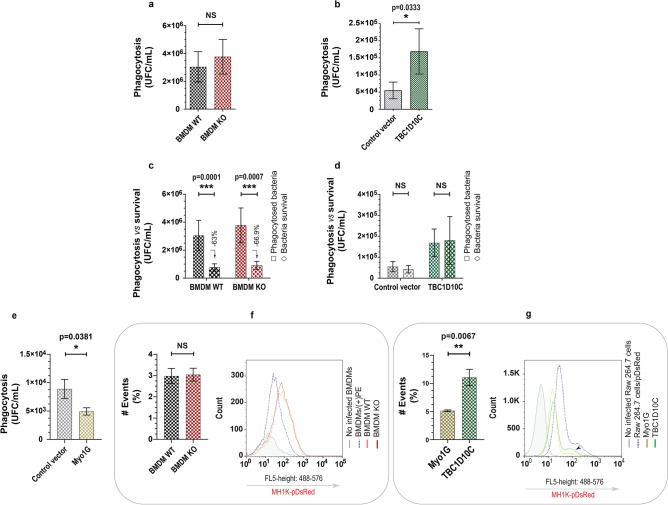
Evaluation of TBC1D10C’s effect on phagocytosis of Burkholderia cenocepacia. The effect of TBC1D10C elimination and overexpression on phagocytosis of B. cenocepacia was determined by CFU (colony forming unit) quantification in the gentamicine protection assay and flow cytometry at a MOI of 50 (multiplicity of infection). (a) Quantification of CFU (phagocytosed living bacteria at 1.5 h postinfection) in infected BMDMs (mice, n = 7); (b) quantification of CFU in infected Raw 264.7 transfected cells (control vector and TBC1D10C, respectively); (c) quantification of CFU in infected BMDMs at 5 h postinfection (comparison of phagocytosed, in (a) bacteria vs. bacteria survival); (d), quantification of CFU in infected Raw 264.7 transfected cells at 5 h-postinfection (control vector and TBC1D10C, respectively); (e) quantification of CFU in infected Raw 264.7 transfected cells (control vector and Myo1G; unrelated protein to TBC1D10C, respectively); (f) left: data of quantified events expressed as a percentage of BMDMs infected with transformed B. cenocepacia (MH1K-pDsRed) by flow cytometry, right, representative histogram of 2 independent experiments for (f)(BMDM/( +)PE is positive control for infection: MH1K-pDsRed); (g) left: data for quantified events expressed as a percentage of Raw 264.7 transfected macrophages infected with transformed B. cenocepacia (MH1K-pDsRed) by flow cytometry, right, representative histogram of 2 independent experiments for (g) (Raw 264.7 cells/pDsRed is positive control for infection; cells highly infected). Data were analyzed by the Mann–Whitney test (P < 0.05), and graphs show SEM.

