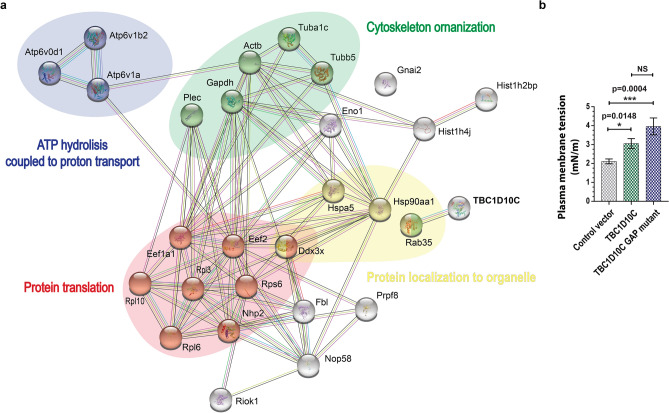
Figure 4.
Protein–protein interaction (PPI) analysis of TBC1D10C-interacting proteins and measurement of cell membrane stiffness. (a) The TBC1D10C interaction network was built from the STRING database with a confidence score > 0.4. The network contains 28 nodes and 90 edges. PPI analysis indicated multiple TBC1D10C-associated complexes. TBC1D10C is highlighted in bold capital letters; (b) membrane stiffness of TBC1D10C-transfected Raw264.7 macrophages was determined by atomic force microscopy (AFM). (20, control vector; 30, TBC1D10C; 16 TBC1D10C GAP mutant). Data were analyzed by the Mann–Whitney test (P < 0.05), and the graph shows SEM.

