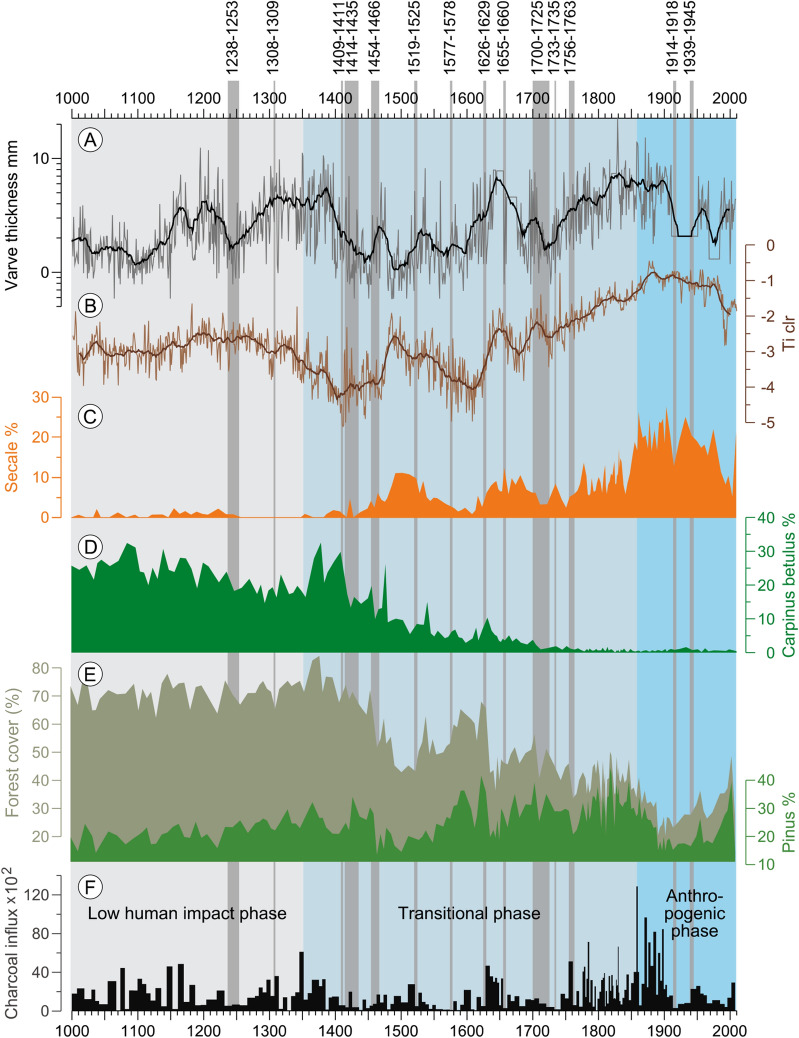
Figure 2.
Sediment proxy data for the last 1000 years obtained from Lake Czechowskie cores. From top to bottom: (A) Varve thickness (21 running mean (bold line) and annual data; (B) Titanium (Ti) counts (clr) from XRF scanning at 50 mm resolution and 21 running mean (bold line) as proxy for detrital catchment material. (C) Secale % (indicator for agricultural land area), (D) Carpinus % (hardwood species used for buildings), (E) Forest cover % (proxy for land openness) and Pinus % (typical regional pioneer tree species) all pollen data are presented REVEALS transformation with the REVEALSinR function from the R package ‘disqover’ (Theuerkauf, et al.57 see methods). (F) Charcoal influx as proxy for fires. The grey bars indicate periods of wars in the region.

