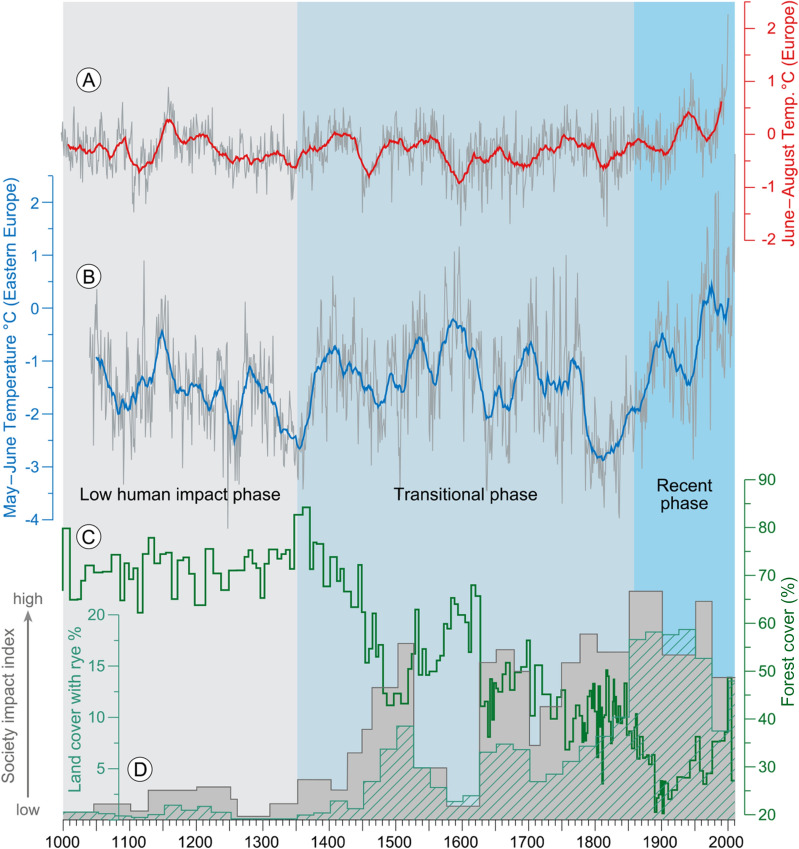
Figure 3.
European summer June–August temperature reconstruction (A) anomalies with respect to reference period AD 1500 – AD 1850) from42; (B) Eastern European May–June temperature reconstruction from tree rings (deviation from mean of reference period 1961–1990)41; (C) Forest cover calculated from arboreal pollen (AP) with the REVEALSinR function from the R package ‘disqover’ Theuerkauf, et al.57; (D) Society Impact Index for 50-year means (grey bars) derived from % land cover with rye (green dashed bars) and historical information (see supplement).

