
Fig. 2. Microbial community composition and distribution in the NESAP water column.
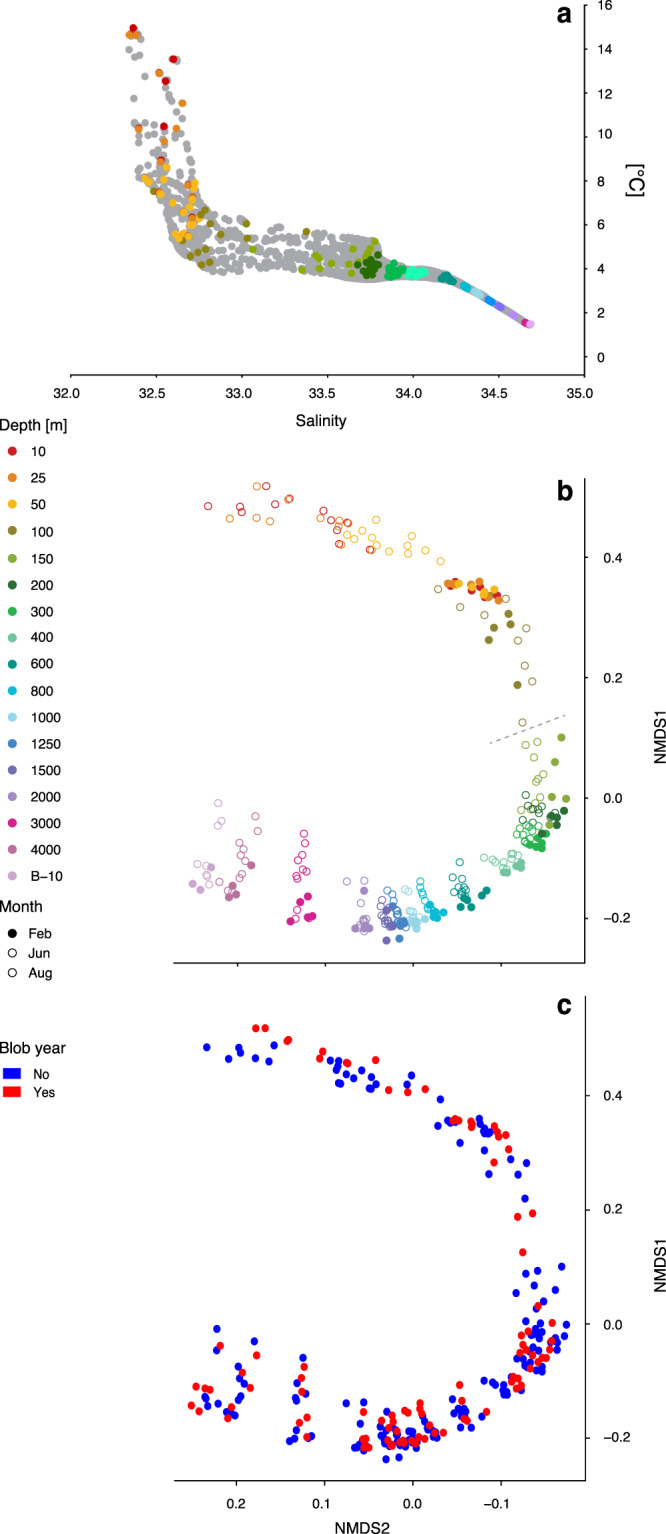
a Temperature versus salinity plot (T-S) from full depth profiles representing the sampled hydrospace in the present study, with colored circles indicating microbial sampling depths. Bray-Curtis dissimilarity of all samples in a non-metric multidimensional scaling (nMDS) plot colored by b sampling depth and c whether it was a pre-Blob (No) or Blob (Yes) year. The dotted line on b mark the maximum mixed layer depth at Ocean Station Papa, as indicated on Fig. 1b.