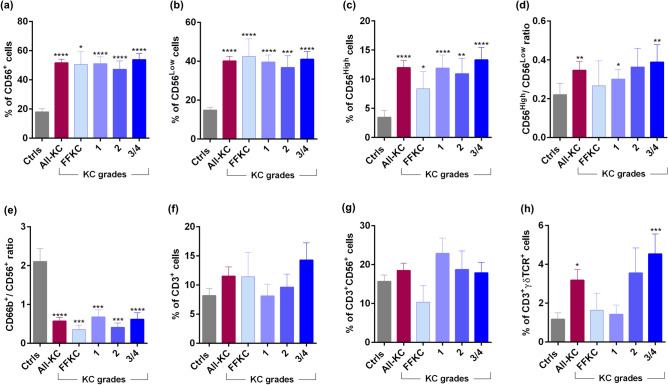
Figure 2.
Ocular surface natural killer cells subsets and T cell subsets proportions in KC patients: The graphs indicate the percentage of CD45+CD56Total (Total Natural Killer—NK) cells (a), CD45+CD56Low—cytotoxic NK cells (b) and CD45+CD56High—cytokine producing low cytotoxic NK cells (c) within the leukocyte population in ocular surface wash samples of eyes with different grades of KC. The graph in panel (d) represent the ratio of cytotoxic NK cells to cytokine producing NK cells—CD56High/CD56Low and the graph in panel (e) represent the ratio of neutrophils to NK cells within the leukocyte population in ocular surface wash samples of eyes with different grades of KC. The graphs indicate the percentage of CD45+CD3+—Pan-T cells (f), CD45+CD3+CD56+ (Natural Killer T) cells (g) and CD45+CD3+γδTCR+ (gamma delta) T cells (h) within the leukocyte population in ocular surface wash samples of eyes with different grades of KC. Ctrls—Controls; FFKC—Forme fruste keratoconus; All-KC—all the grades of keratoconus combined; SEM—standard error of the mean; Controls (23 eyes), All-KC (51 eyes), FFKC (6 eyes), grade 1 KC (14 eyes), grade 2 KC (8 eyes), grade 3 or 4 (23 eyes); Bar graphs represent Mean ± SEM; *P < 0.05, **P < 0.01,***P < 0.001, ****P < 0.0001, Mann–Whitney test.

