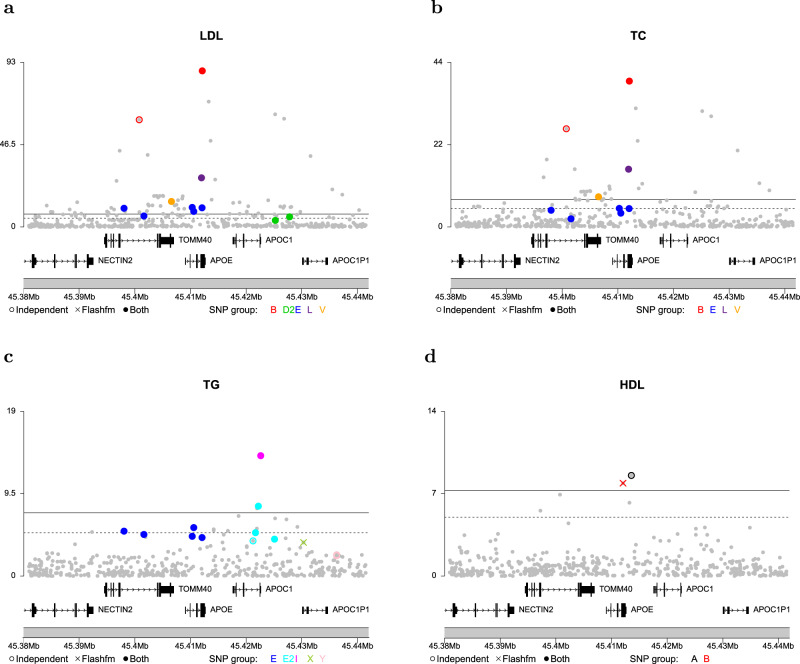
Fig. 3. Fine-mapping of signals for four lipid traits in region 19:45380937-45441453.
The -log10p for SNPs in the top SNP groups for a LDL; b total cholesterol (TC); c triglycerides (TG); d HDL are shown for both FINEMAP and flashfm. The two methods agree on a 5-SNP model for LDL (a) and a 4-SNP model for TC (b). The top model for TG (c) has 4 SNPs under both methods but differ in one SNP group; FINEMAP prefers 3-SNP group Y (very near one another so appear as one) and flashfm selected single SNP group X (mean r2 of SNPs in Y with X is 0.315). For HDL (d), a different single-SNP model was selected by the two methods; FINEMAP favoured group A, whereas flashfm selected group B. The solid coloured circles show SNPs that belong to the SNP groups constructed by both methods, the empty coloured circles represent SNPs that are only in the FINEMAP SNP group; solid grey circles show all other SNPs in the region. In c and d an X represents a SNP that appeared in a top model for flashfm and not FINEMAP and empty circles indicate SNPs that appeared in top models for FINEMAP and not flashfm. Position is given according to hg19/build 37. Some of the genes in this region include APOE, APOC1 and TOMM40.

