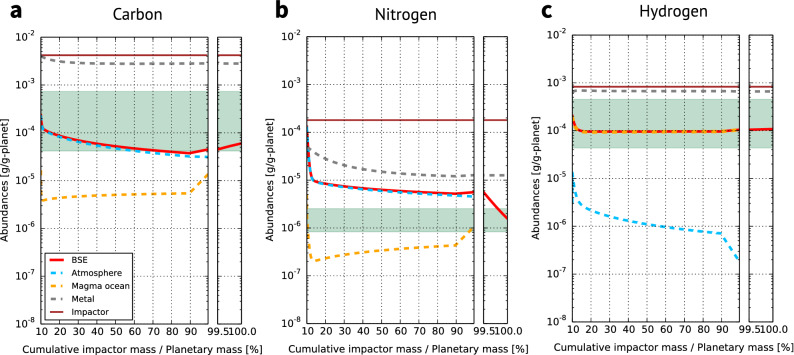
Figure 3.
Evolution of the abundances of C, N, and H in the surface and interior reservoirs over the full accretion obtained from the nominal model. Dashed lines correspond to the amounts in the atmosphere (light-blue), magma ocean (orange), and metallic core (grey) for the main accretion phase and in the surface reservoirs (the atmosphere, oceans, and carbonate rocks: red solid line) for the late accretion phase. Solid lines mean the net cumulated into the bulk silicate Earth (BSE; red) and delivered by impactors (brown). The green areas denote the amounts in the current BSE. Plotted abundances are scaled by the planetary mass at a given time.

