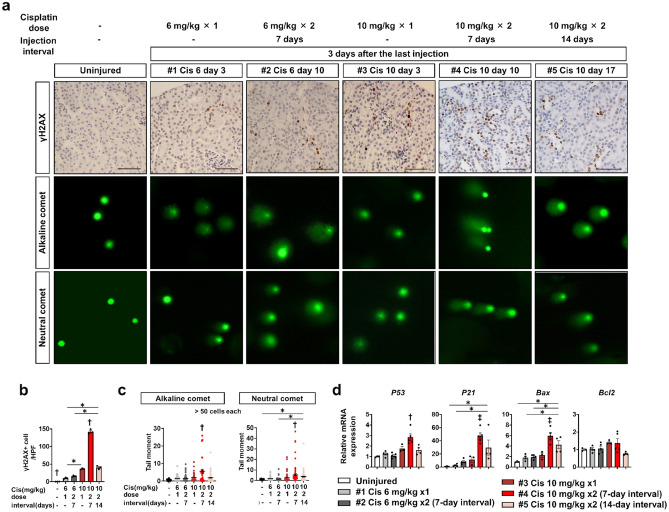
Figure 4.
Assessment of DNA damage after different frequencies, doses, and intervals of cisplatin injection. (a) Representative images of immunostaining of γH2AX and comet assay of isolated kidney cells at three days after the last injection. (b) Quantification of the number of γH2AX + cells. (c) Quantitative analysis of alkaline comet and neutral comet. (d) Quantitative PCR of whole kidneys for the downstream target genes of DNA damage (p53, p21, Bax, and Bcl2). Data are the mean ± SE. *P < 0.05, †P < 0.05 vs other groups, ‡P < 0.05 vs Uninjured or #1–3 groups. Scale bar = 100 μm.

