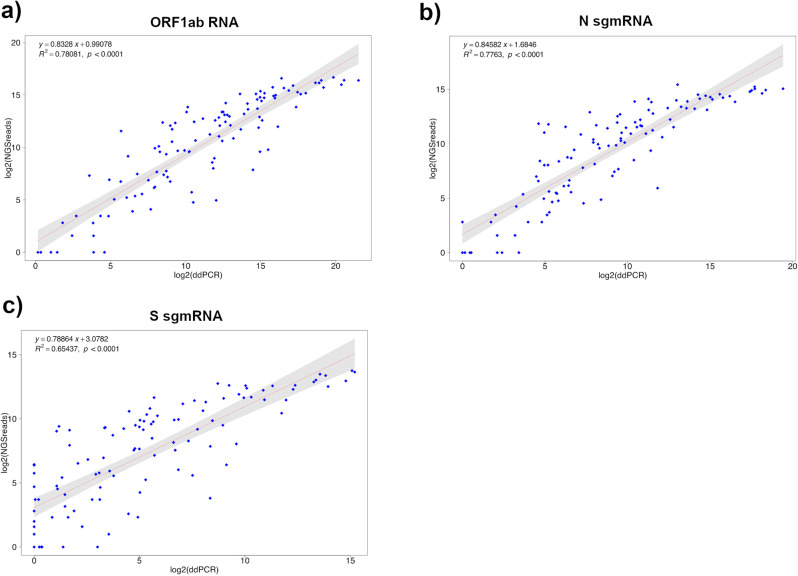
Fig. 3. Correlation between ddPCR and transcriptomics data for SARS-CoV-2 ORF1ab, N and S sgmRNA targets.
Linear correlation between ddPCR and sequencing quantification of SARS-CoV-2 ORF1ab gRNA (a), N sgmRNA (b), and S sgmRNA (c) calculated on 110 SARS-CoV2 positive RNA samples, by means of a bivariate linear fit analysis (p-value < 0.0001). On X-axis: log2 scaled ddPCR quantification; on Y-axis: log2 scaled meta-transcriptomics reads count. The regression equation and R2 are reported in the top-left corner. The gray area represents a 0.95 level of confidence interval.

