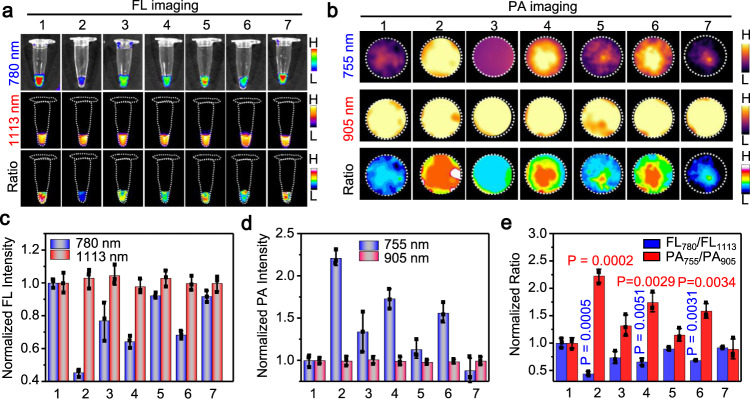
Fig. 4. Ratiometric near-infrared fluorescence/photoacoustic imaging of intracellular •OH.
a Fluorescence (FL) (780 and 1113 nm) and ratiometric FL780/FL1113 images, and b Photoacoustic (PA) images (755 and 905 nm) and ratiometric PA755/PA905 images of RAW264.7 cells (~5 × 10⁵ cells) upon treatment with 1-NP (56/1.65/20 μM 1-Br-Et/NIR775/IR1048) for 3 h plus different conditions. 1: Ctrl; 2: 200 μM Fe2+ + 1 mM H2O2; 3: 200 μM Fe2+ + 1 mM H2O2 + tempol (200 μM); 4: Lipopolysaccharide (LPS) (20 μg mL−1); 5: LPS (20 μg mL−1) + tempol (200 μM); 6: Phorbol 12-myristate 13-acetate (PMA) (20 μg mL−1); 7: PMA (20 μg mL−1) + tempol (200 μM). c Normalized FL and d PA intensities of RAW264.7 cells under indicated treatment. e Normalized FL780/FL1113 ratios and PA755/PA905 ratios of RAW264.7 cells under indicated treatment. Data are presented as mean ± s.d. (n = 3 independent cell pellets). Statistical differences were analyzed by Student’s two-sided t-test between Ctrl and indicated groups. Source data are provided as a Source Data file.

