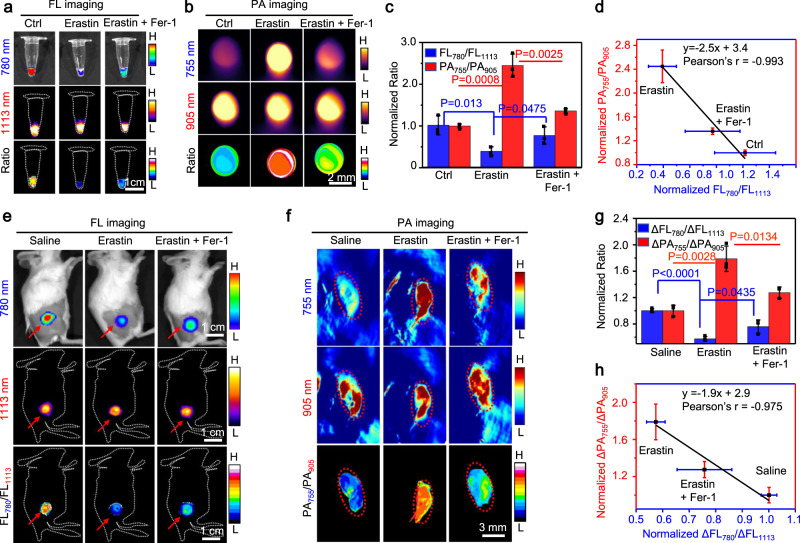
Fig. 5. Ratiometric bimodal imaging of •OH in 4T1 tumors undergoing ferroptosis.
a Fluorescence (FL) (780 and 1113 nm) and ratiometric FL780/FL1113 images, and b Photoacoustic (PA) images (755 and 905 nm) and ratiometric PA755/PA905 images of 4T1 cells upon incubation with 1-NP-FA (Ctrl), 1-NP-FA + erastin or 1-NP-FA + erastin + Fer-1. Cells were untreated (Ctrl), or pretreated with 10 μM erastin to induce ferroptosis, or 10 μM erastin plus 10 μM Fer-1 for 6 h, and then incubated with 1-NP-FA (56/1.65/20 μM 1-Br-Et/NIR775/IR1048) for another 2 h. c Normalized FL780/FL1113 and PA755/PA905 ratios of 4T1 cells treated with indicated conditions in a and b. d Plot of the FL780/FL1113 ratios versus PA755/PA905 ratios shows a strong correlation (r = −0.993) between them in 4T1 cells after indicated treatment. e FL and ratiometric FL780/FL1113 images, and f PA images and ratiometric PA755/PA905 images of s.c. 4T1 tumors upon treatment with saline, erastin or erastin plus Fer-1, followed by intravenous (i.v.) injection of 1-NP-FA. Mice with subcutaneous (s.c.) 4T1 tumors were intraperitoneal (i.p.) injected with saline, erastin (20 mg kg−1) or erastin (20 mg kg−1) plus Fer-1 (20 mg kg−1), and 12 h later, 1-NP-FA (1.68/0.05/0.6 mM 1-Br-Et/NIR775/IR1048, 200 μL) were i.v. injected into mice. After 24 h, the FL and PA images were acquired. Red arrows in (e) and red circles in (f) indicate the tumor locations. g Normalized ΔFL780/ΔFL1113 and ΔPA755/ΔPA905 ratios in 4T1 tumors following indicated treatment. h Plot of the ΔFL780/ΔFL1113 ratios versus ΔPA755/ΔPA905 ratios show a strong correlation (r = −0.975) between them in 4T1 tumors following indicated treatment. Data are presented as mean ± s.d. (n = 3 independent cell pellets or mice). Statistical differences were analyzed by Student’s two-sided t-test. Source data are provided as a Source Data file.

