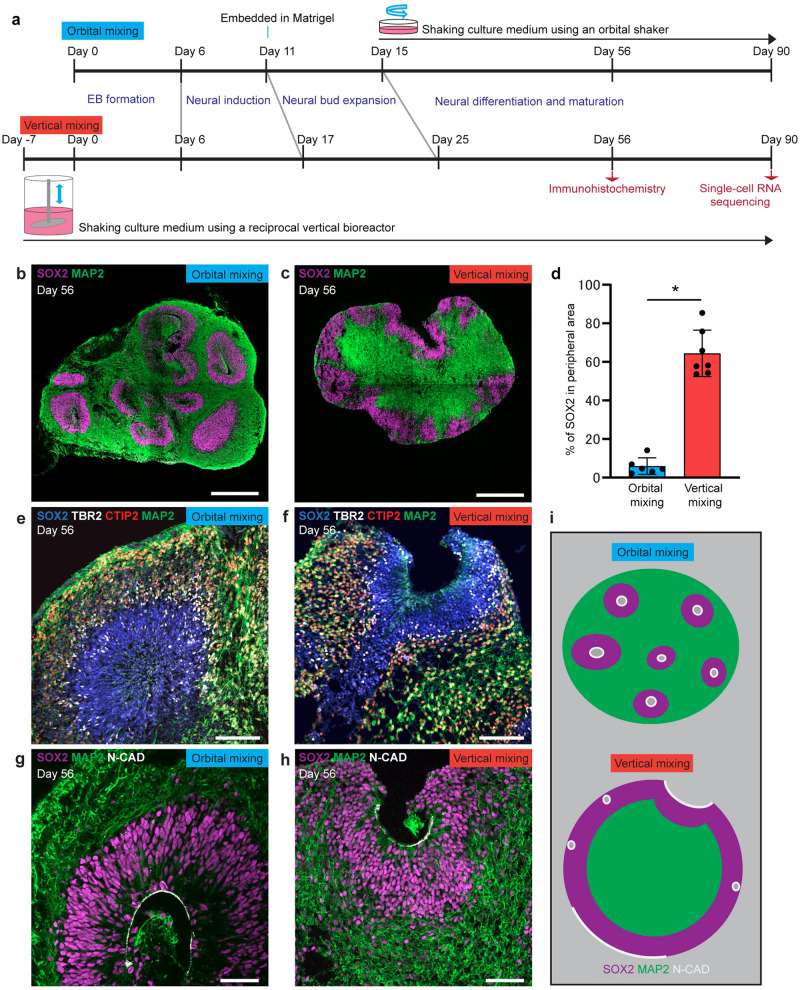
Fig. 1. Brain organoid generated by vertical mixing showed inverted structure in comparison with brain organoid generated by orbital mixing.
a Schematic diagram of conditions used to induce brain organoid by orbital mixing (upper schema) and by vertical mixing (lower schema). b, c Immunostaining for neural progenitor (SOX2, magenta) and neuron (MAP2, green) in brain organoid generated by orbital mixing (b) or vertical mixing (c) on Day 56. d Quantification of SOX2-positive area in the peripheral region of brain organoid on Day 56. The peripheral region was defined as 100 µm inside from the edge of brain organoid. Brain organoid from vertical mixing showed higher percentage of SOX2-positive area in peripheral region in comparison with brain organoid from orbital mixing. Data represent mean ± SD (n = 6 for brain organoids by orbital mixing, n = 7 for brain organoids by vertical mixing). Difference between the two conditions was analyzed by Student’s two-tailed t-test (*p < 0.0001). e, f Immunostaining for markers of neural progenitors (SOX2, blue), intermediate neural progenitors (TBR2, gray), and cortical neurons (CTIP2, red; MAP2, green) in brain organoids by orbital mixing (e) or vertical mixing (f) on Day 56. g, h Immunostaining for markers of ventricular neuroepithelial cells (N-CADHERIN: N-CAD, gray), neural progenitors (SOX2, magenta), and cortical neurons (MAP2, green) in brain organoids by orbital mixing (g) or vertical mixing (h) on Day 56. Note the apical side of organoids generated by orbital mixing is located inside organoids, while that of organoids generated by vertical mixing is located at the surface of organoids. i Schematic diagram shows the difference of brain organoids by orbital mixing and by vertical mixing. Scale bars = 500 µm (b, c), 100 µm (e, f), 50 µm (g, h).

