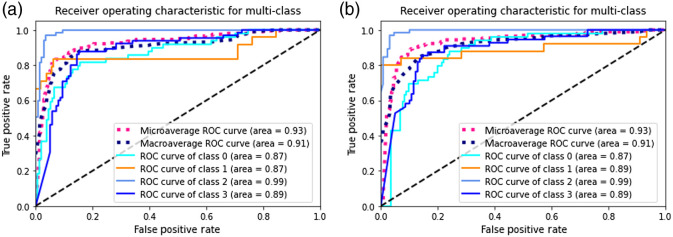
Fig. 5.
ROC curve of each class and micro-/macroaverage combined: (a) trained with RUS and data augmented balanced dataset using focal loss and (b) trained with bootstrap aggregation ensemble method (In this figure, classes 0 to 4 represent class benign, malignant, normal, and premalignant, respectively).

