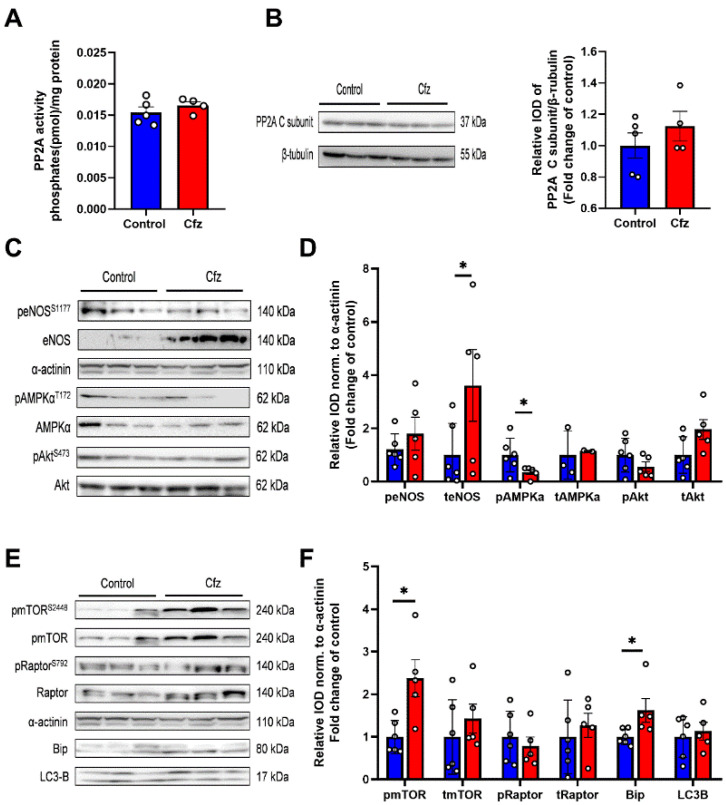
Figure 2.
Two doses of carfilzomib decreased AMPKα phosphorylation and upregulated eNOS and Bip expression and mTOR phosphorylation. Graphs of PP2A (A). Activity (in pmol/mg protein; n = 5 per group) and (B). Εxpression (fold change of control). (C). Representative western blots and (D). Relative densitometry analysis of phosphorylated and total eNOS, AMPKα, and Akt levels normalized to α-actinin. (E) Representative western blots and (F). Relative densitometry analysis of phosphorylated and total mTOR, Raptor, and total Bip and LC3B normalized to α-actinin (n = 6 per group). All protein targets were run on the same gradient SDS page gel. Data are presented as mean ± SEM. Two-tailed, unpaired t-test, * p < 0.05.

