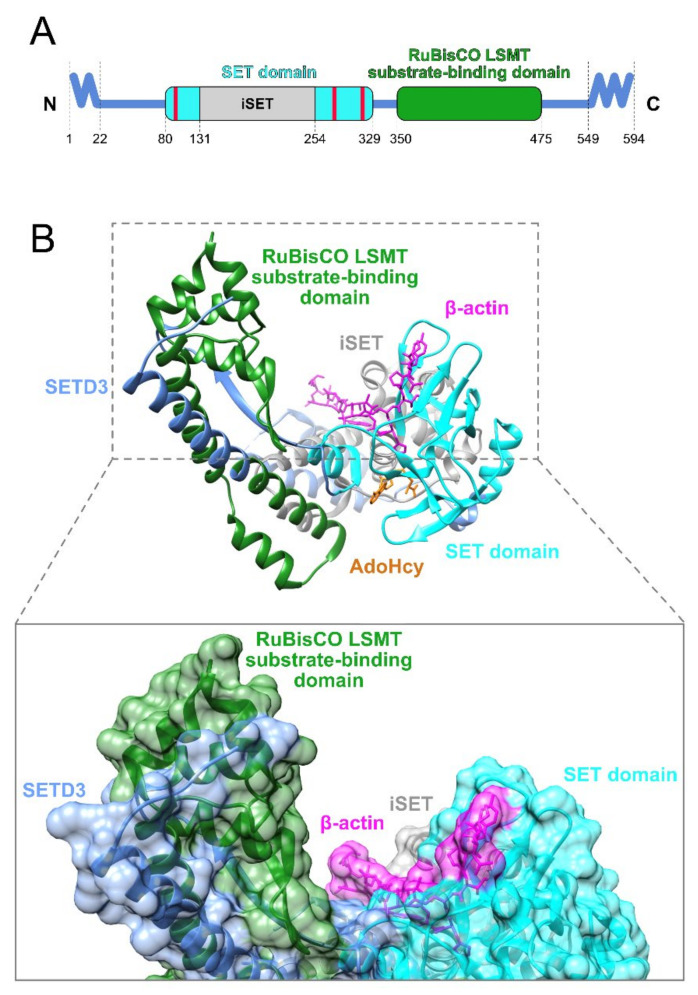
Figure 2.
Structure of human SETD3. (A) Domain composition of SETD3. Waved lines correspond to the disordered regions at the N-terminal and C-terminal of the protein. Red bars indicate the localization of amino acid residues at which AdoMet binds to SETD3. Data were retrieved from the NCBI Protein database (accession number: XP_011535533.2, accessed on 30 July 2021). (B) Conformation of human SETD3 (residues 2–502) in complex with the peptide substrate derived from β-actin (residues 66–88) and close up view of the SETD3 substrate binding cleft with molecular surfaces. The image was created in UCSF Chimera 1.15 software utilizing the coordinates deposited in Protein Data Bank file 6ICV [36]. The color scheme of domains is common in Figure 2 and Figure 3.

