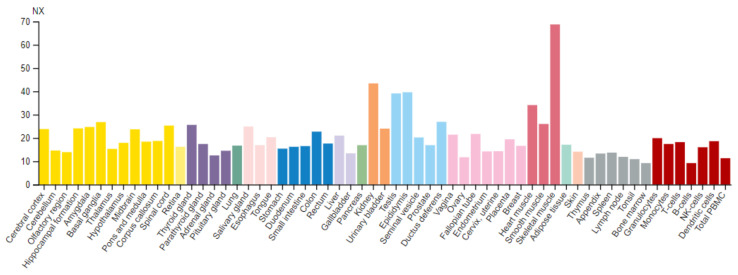
Figure 7.
SETD3 expression in human tissues. RNA data were obtained from the Human Protein Atlas (HPA; https://www.proteinatlas.org, accessed on 29 July 2021) and show consensus normalized expression levels, determined by combining the data from three transcriptomic datasets (HPA, Genotype-Tissue Expression, and FANTOM5) [53]. Color coding is based on tissue groups, each consisting of tissues with common functional features.

