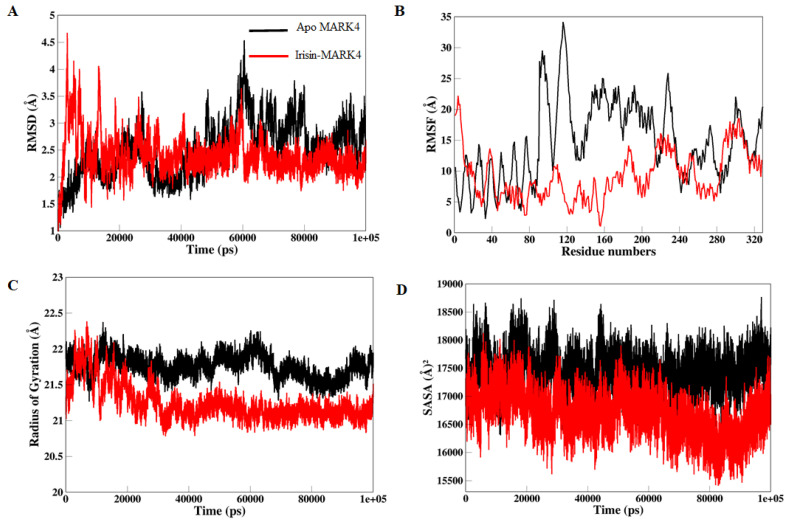
Figure 4.
Structural dynamics of MARK4 apo (black color) and irisin bound MARK4 (black color) enzyme. (A) RMSD, (B) RMSF, (C) Rg values, and (D) SASA values across Cα backbone in Å of apo MARK4 and irisin-MARK4 complex in Å across Cα backbone of both of the two conditions calculated after 100 ns of MD trajectories.

