Figure 1.
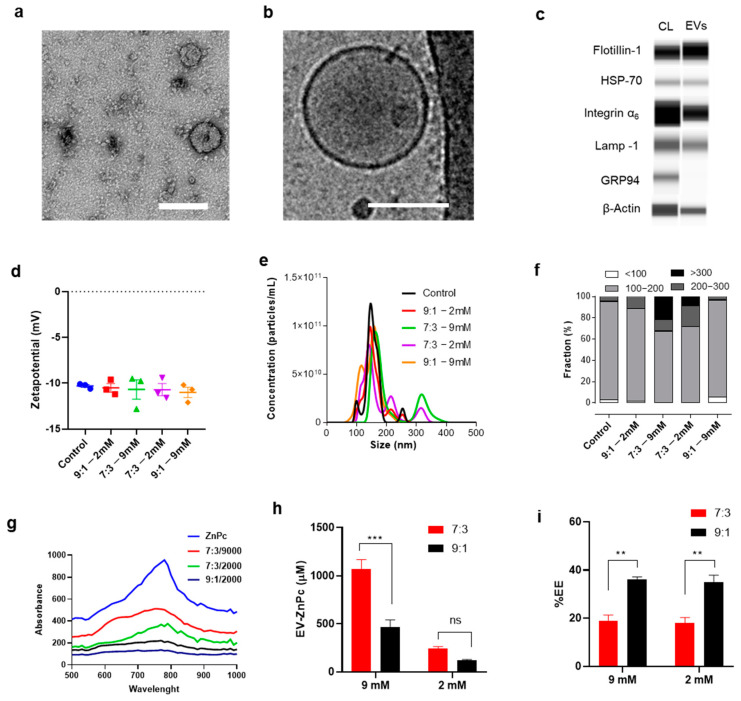
Preparation of EV-ZnPc. Representative (a) TEM, (b) cryo-TEM micrograph, and (c) capillary electrophoresis (CL = cell lysates) of EVs isolated from B16F10. EVs were loaded with different concentrations of ZnPc and characterized by (d) laser doppler anemometry and (e) NTA. (f) The total number of EVs obtained by NTA was used to calculate the proportion of different size fractions. UV-vis spectroscopy was used to obtain the (g) absorption curves, (h) concentration of samples, and (i) encapsulation efficiency (EE). Scale bars are 100 nm. *** p < 0.001; ** p < 0.01; mean ± SEM; n = 3).

