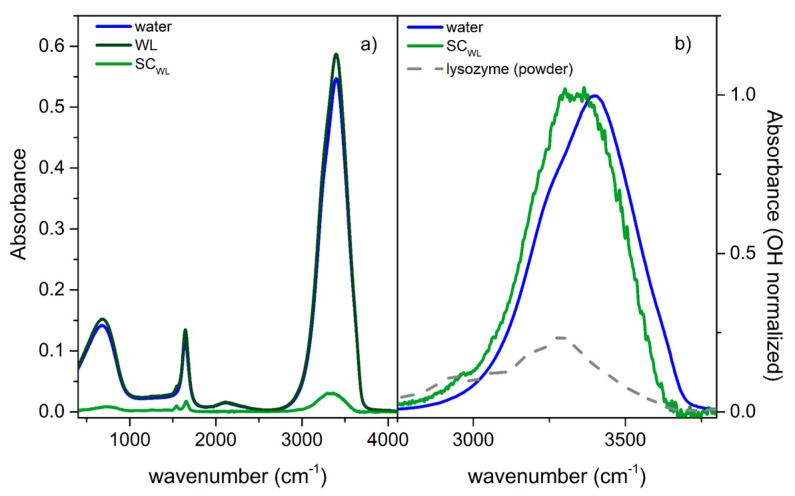
Figure 5.
(a) ATR-FTIR spectrum of the WL solution (dark green line), the rescaled ATR-FTIR spectrum of neat water (blue line), and the resulting SC-IR spectrum (green line) (see the experimental section for details). (b) Comparison, in the OH stretching region, between the SC-IR spectrum and the maximum-normalized spectrum of neat water (blue line). The ATR-FTIR spectrum of solid lysozyme, normalized at around 2900 cm−1 (CH stretching signal), is also reported.

