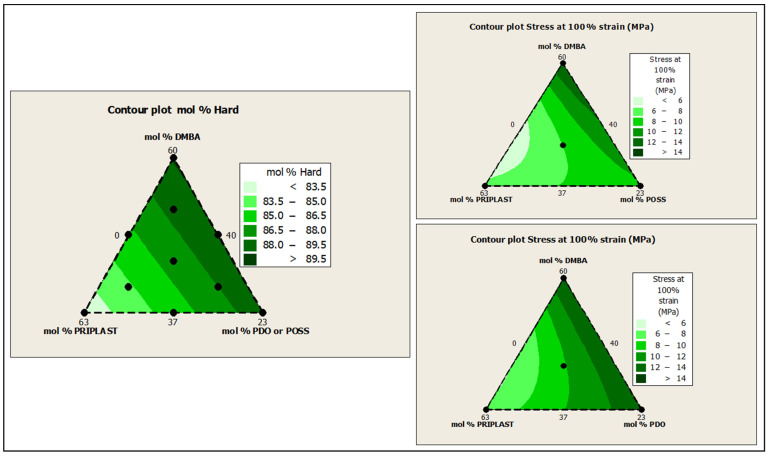
Figure 13.
Contour plots obtained using the Minitab software from the ternary mixture experimental design. Left: contour plot of hard segment content in mol%. Upper right: contour plot of σ100% (stress at 100% strain) for the ternary mixture design with POSS-OH. Bottom right: contour plot of σ100% for the ternary mixture design with PDO.

