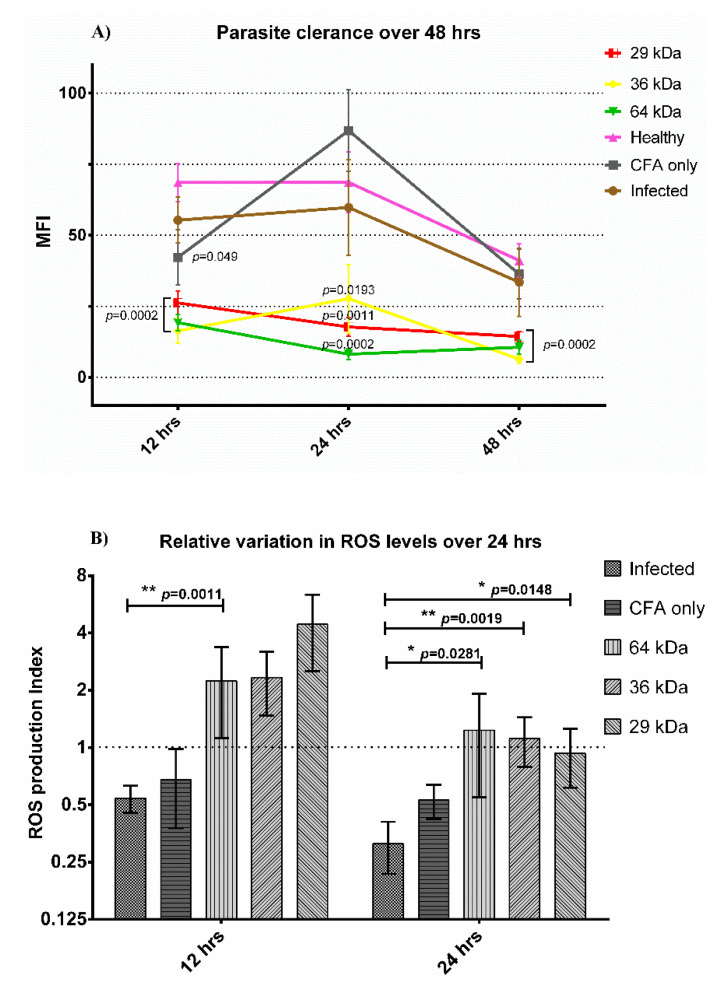
Figure 4.
(A) Parasite clearance observed at different time intervals. Statistical comparison between healthy and test groups. Average MFI (mean fluorescent intensity) at different time points from adherent peritoneal cells of different animal groups. (B) Variation in ROS production levels over 24 h. ROS is expressed relative to healthy control, ROS production index (RPI) = MFI test group/MFI healthy group. The dashed line indicates the expression levels of healthy cells. CFA: Freund’s adjuvant. n = 8, mean values ± SEM. (A) Statistical comparison of Student’s t-test between the test group and healthy group. Level of significance, ns p > 0.05, * p ≤ 0.05, ** p ≤ 0.01.

