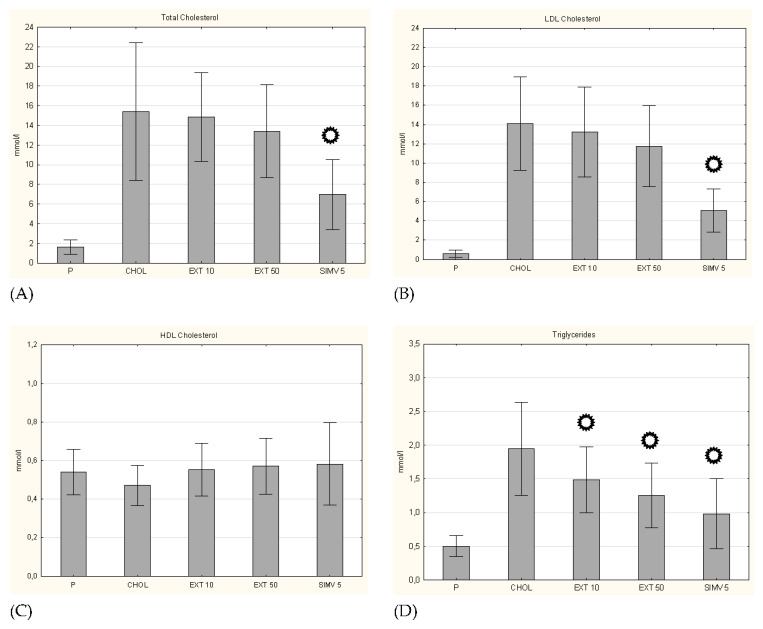
Figure 2.
Serum lipid levels. (A) total cholesterol, (B) LDL cholesterol, (C) HDL cholesterol, and (D) triglycerides levels on day 60. of the study. P–standard chow; CHOL–standard chow + 1% cholesterol; EXT 10–standard chow + 1% cholesterol + cornelian cherry extract 10 mg/kg b.w.; EXT 50–standard chow + 1% cholesterol + cornelian cherry extract 50 mg/kg b.w.; SIMV 5–standard chow + 1% cholesterol + simvastatin 5 mg/kg b.w. Values are presented as mean ± SD.  p < 0.05 vs. CHOL.

