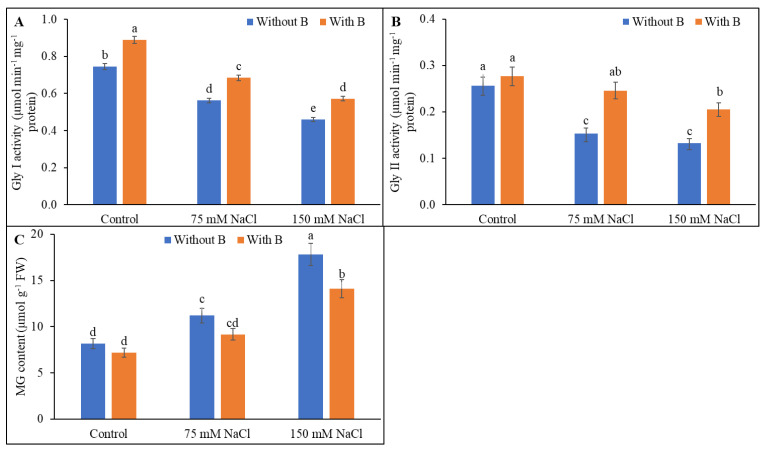
Figure 7.
Activities of glyoxalase I (A), glyoxalase II (B), and level of MG (C) of soybean as affected by salt stress with or without B supplementation. Twenty-day-old plants were imposed with two levels of salt (75 and 150 mM NaCl, 30 days) and a set of plants were supplemented with B (1 mM boric acid). Control treatments were grown without salt. Mean (±SD) was computed from three replicates for each treatment. Different letters over the bars indicate significant differences at p ≤ 0.05 applying Tukey’s HSD test.

