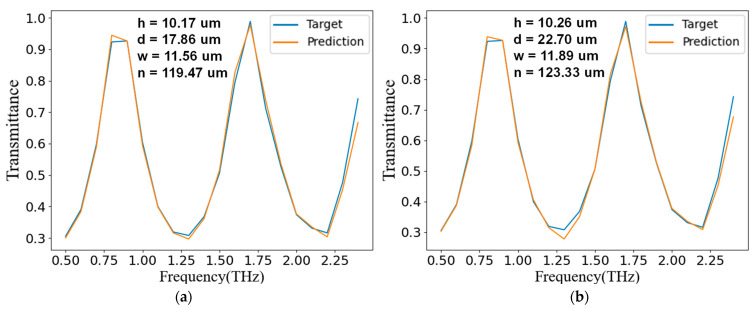
Figure 11.
The generator training results. The blue line is the input target frequency-transmittance curve, the upper-center four sets of structural parameters are the output, and the orange line is the frequency-transmittance curve predicted by the discriminator based on the structural parameters output by the generator. The figures in (a,b) are the running results of inputting the same target curve and different random noises.

