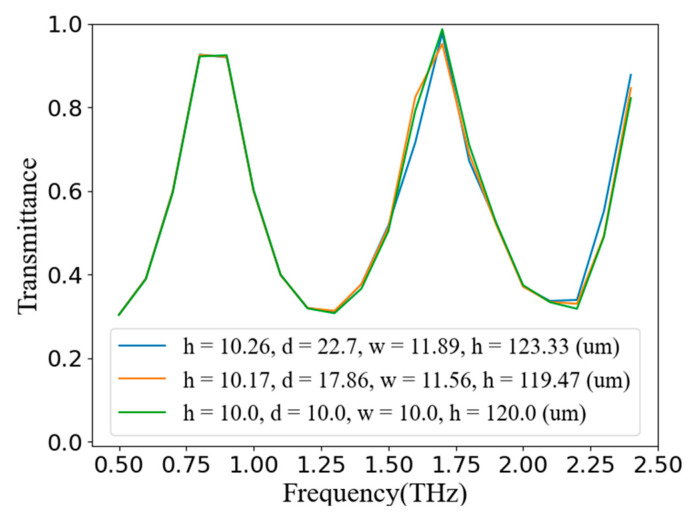
Figure 12.
The simulation verification results. All three curves are from the COMSOL simulation results. The blue line is the simulation result produced by the structural parameters outputted by the generator in Figure 11b. The orange line is the simulation result of the structural parameters predicted by the generator in Figure 11a. The green line is the original simulation data and result corresponding to the target curve.

