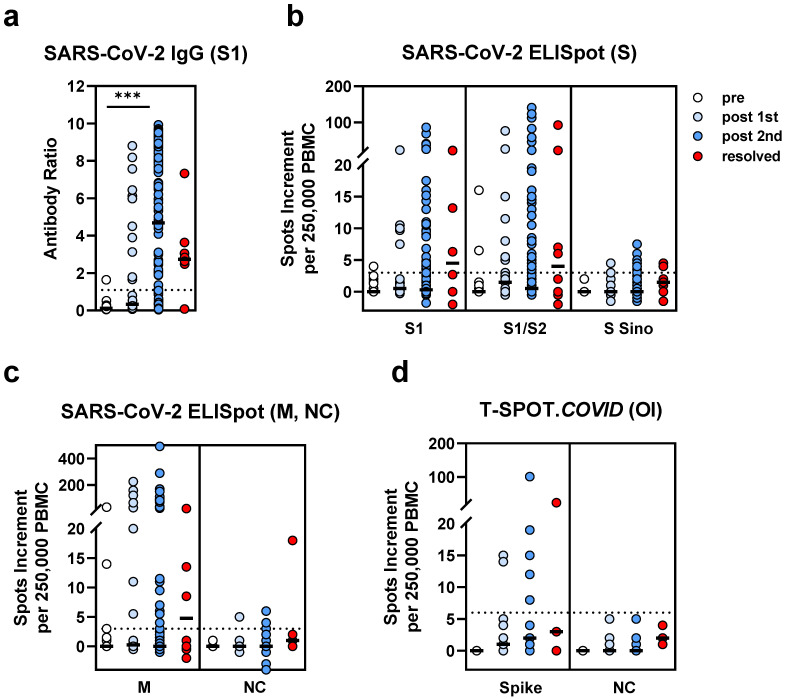
Figure 3.
SARS-CoV-2-specific IgG and ELISpot responses in hematopoietic stem cell transplant recipients. We compared data in patients prior to SARS-CoV-2 vaccination (pre, n = 19), after the first vaccination (post 1st, n = 28), after the second vaccination (post 2nd, n= 117) and after infection (resolved, n = 8). Panel (a) shows IgG antibody responses against SARS-CoV-2 spike (S) 1, (b) ELISpot responses to S antigens (S) and (c) to membrane (M) and nucleocapsid (NC). For comparison with these in house ELISpot assays (b,c), results of the T-SPOT.COVID (Oxford Immunotec, OI) are shown as panel (d). Parallel tests with both ELISpot formats were performed in 25 patients. Horizontal bold lines indicate median values, and dashed lines the cutoff for positive responses (antibody ratio of 1.1, 3 spots increment for in house ELISpot assays and 6 spots increment for the T-SPOT.COVID). S1-peptide mix of the SARS-CoV-2 spike (S) 1; S1/S2-peptide mix of the spike (S) 1 and S2; S Sino-S1 protein (Sino Biological); M-peptide mix of the membrane; NC-peptide mix of the nucleocapsid. *** p < 0.0001 (Kruskal–Wallis test).

