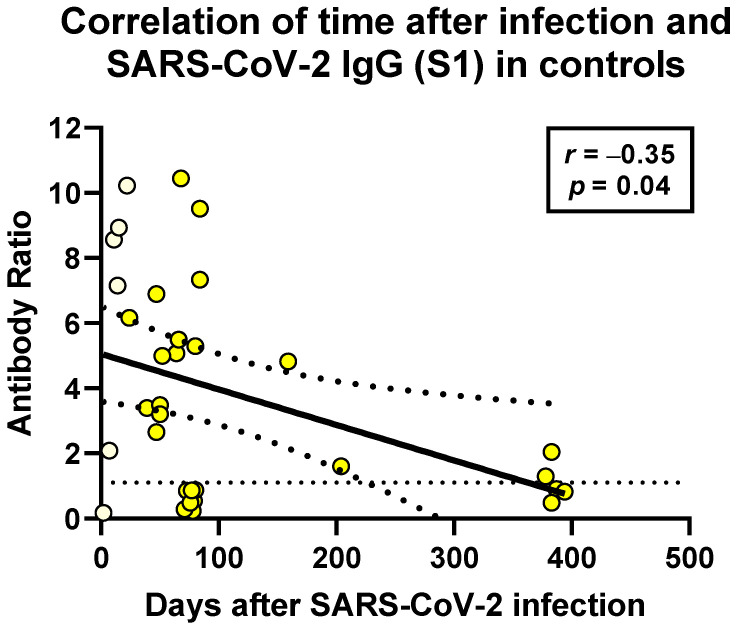
Figure 7.
Spearman correlation analysis of SARS-CoV-2-specific IgG and distance to SARS-CoV-2 infection in non-immunosuppressed controls (n = 33). This analysis includes six data sets after acute infection (light yellow) and 27 after resolved SARS-CoV-2 infection (bright yellow). In the remaining controls, sera for antibody testing or information on the date of infection was not available. The horizontal dashed line indicates the cutoff for positive antibody responses (ratio of 1.1). The bold, continuous line indicates the regression line, and the two dashed lines the 95% confidence interval.

