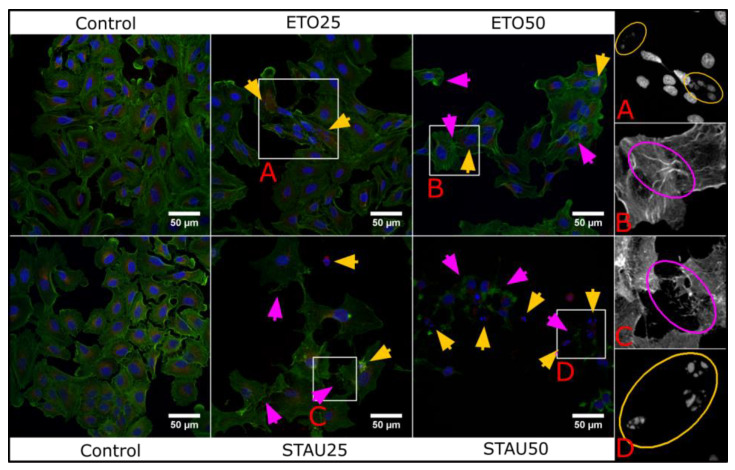
Figure 16.
Morphological changes induced by Eto and Stau in A549 cell line at IC25 and IC50. Yellow arrows indicate nuclear fragmentation/damage and magenta arrows show cytoskeleton degradation. The panel in the right presents single channel regions of interest to highlight the structural features in a more detailed manner.

