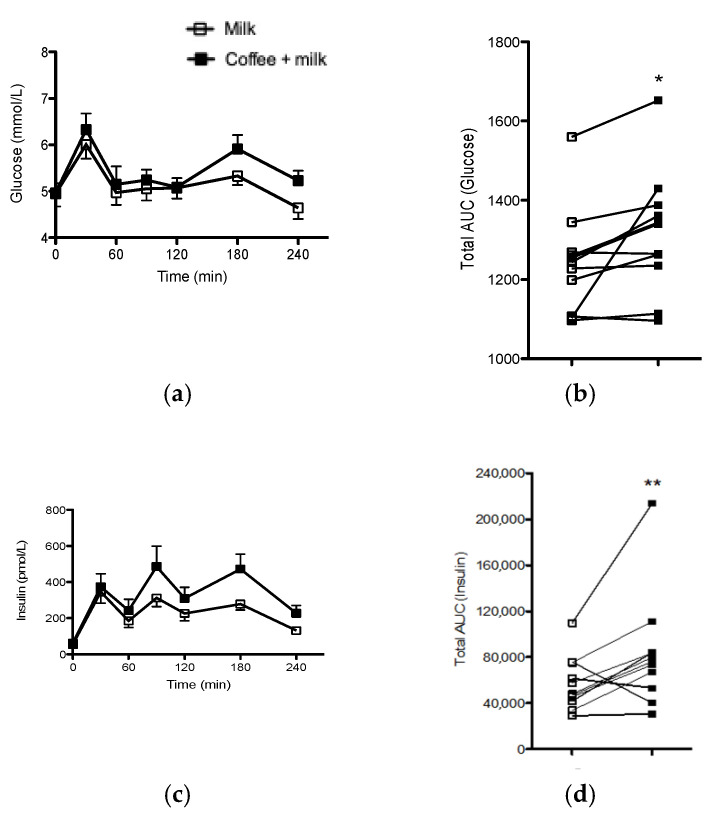
Figure 5.
Glycemic (a) and insulinemic curve (c) in the seven time points during the 4-h recovery; individual glucose (b) and insulin (d) TAUC of healthy endurance-trained adult men treated or not with coffee. * p = 0.02 for glucose TAUC (coffee + milk vs. Milk); ** p = 0.03 for insulin TAUC (Coffee + milk vs. Milk). Repeated procedure method, Proc Mixed (SAS studio).

