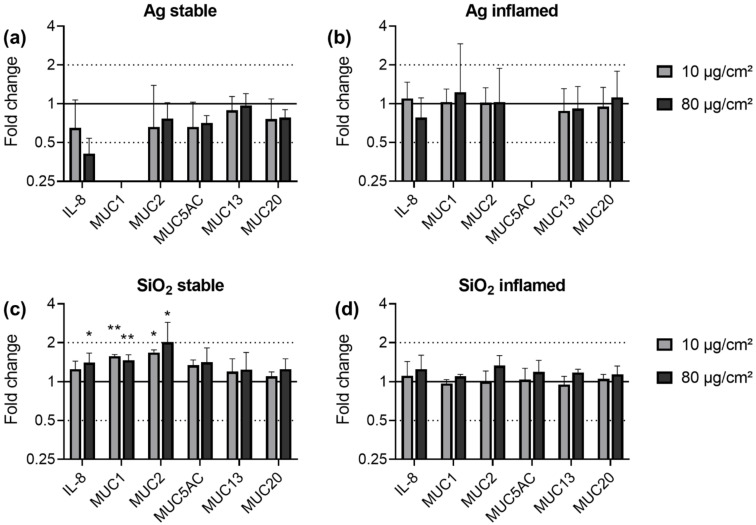
Figure 6.
Gene expression of IL-8 and mucins in stable (a,c) and inflamed (b,d) triple cultures upon exposure to Ag (a,b) and SiO2 (c,d). Triple cultures were exposed to 10 and 80 µg/cm2 ENM for 24 h. The relative gene expression of IL-8, MUC1, MUC2, MUC5AC, MUC13, and MUC20 was assessed by qRT-PCR. The results were normalized to the unexposed negative controls and β-Actin as reference gene. The depicted fold changes with SD were derived from the mean and SD of the ΔΔCT-values of N = 3 independent experiments (t-test; * p ≤ 0.05; ** p ≤ 0.01).

