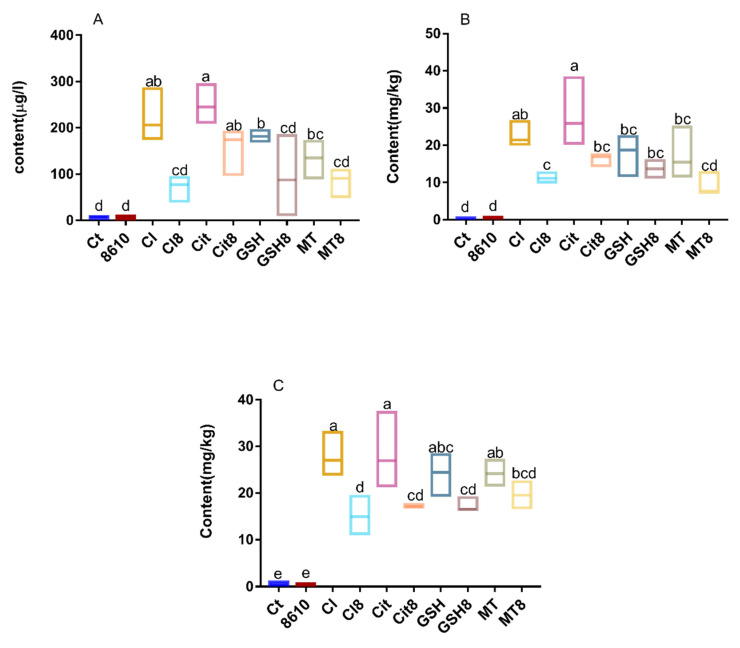
Figure 1.
Changes in cadmium content in the blood (A), liver (B), and kidneys (C) of mice. Ct, Control; 8610, CCFM8610 treatment only; Cl, CdCl2; Cl8, CdCl2 + CCFM8610; Cit, Cd–citrate; Cit8, Cd–citrate + CCFM8610; GSH, Cd–glutathione (Cd–GSH); GSH8, Cd–GSH + CCFM8610; MT, Cd–Metallothionein (Cd–MT); MT8, Cd–MT + 8610. Different small letters in the figures indicate significant differences at p < 0.05. See also in following figures.

