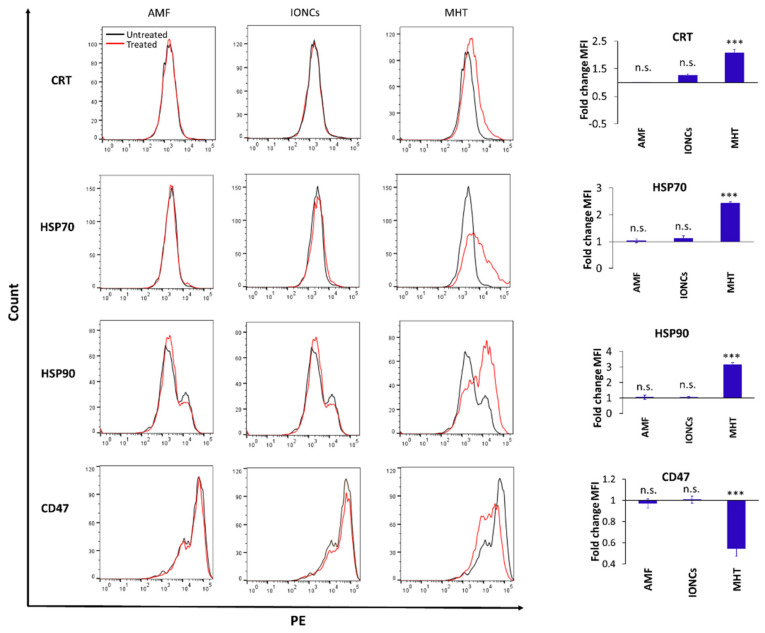
Figure 4.
Flow cytometric evaluation of changes in surface expression of ICD-associated markers at 24 h post-treatment: CRT, HSP70, HSP90 and CD47 on U87 cells exposed to different treatments including AMF only (AMF), IONCs only (IONCs) and IONCs + AMF (MHT) over untreated cells. Data are presented as representative histograms and average fold change (mean ± SEM) of the mean fluorescence intensity (MFI) of three independent experiments (n = 3). Statistical analysis was conducted via two−tailed unpaired student’s t test (*** p < 0.001; n.s. = not significant).

