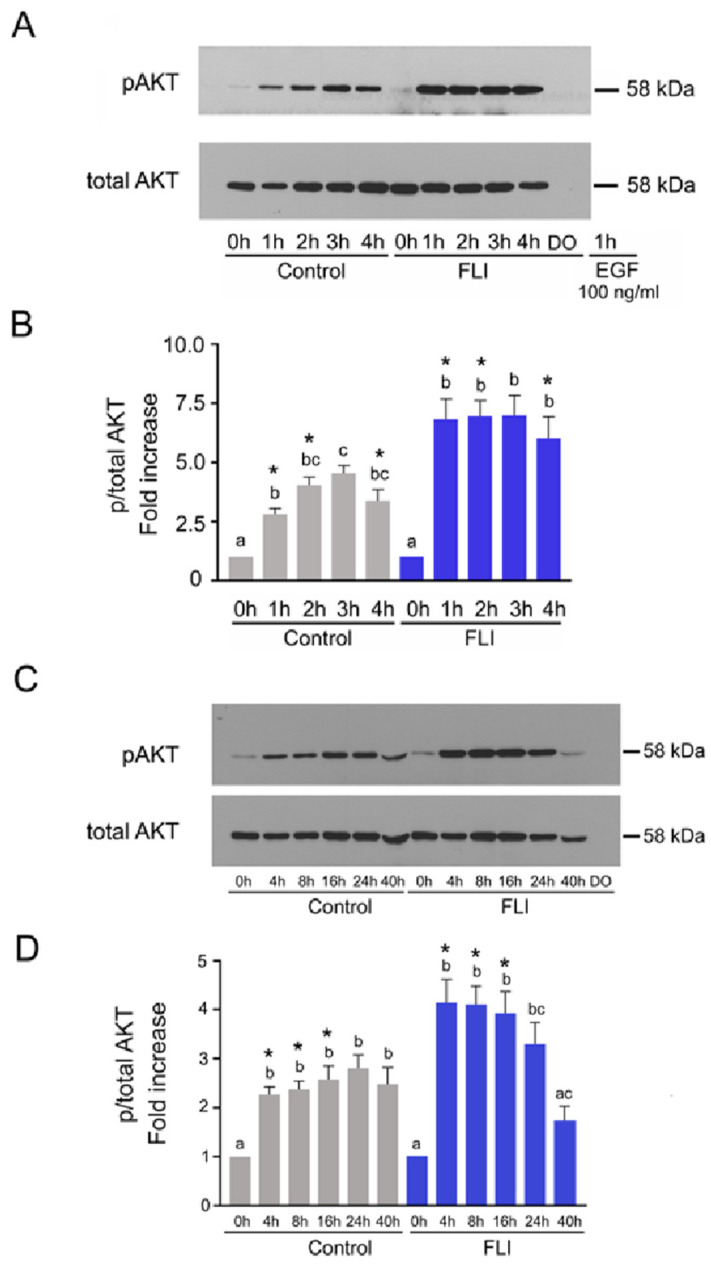
Figure 2.
Time course of AKT activation in COCs culture in control and FLI medium. Activation of AKT in control and FLI medium during short-term (A) or long-term (C) culture. The panels show representative results of immunoblotting of phosphorylated and total AKT in samples of 25 COCs cultured in vitro for the indicated periods of time. Denuded oocytes (DO) cultured for 4 or 40 h were used for assessing their contribution to the entire COC signal. Quantification of the activated AKT in three independent experiments was performed by densitometry and is shown in the graphs as proportions of phosphorylated and total AKT, and expressed in arbitrary units as the fold increase over the proportion found in unstimulated COCs at the beginning of the culture (B,D). The different superscripts or superscripts with no common letter above the columns indicate significant differences within the same treatment. The asterisks above the columns indicate a significant difference between the treatments at the same time of culture (p < 0.05).

