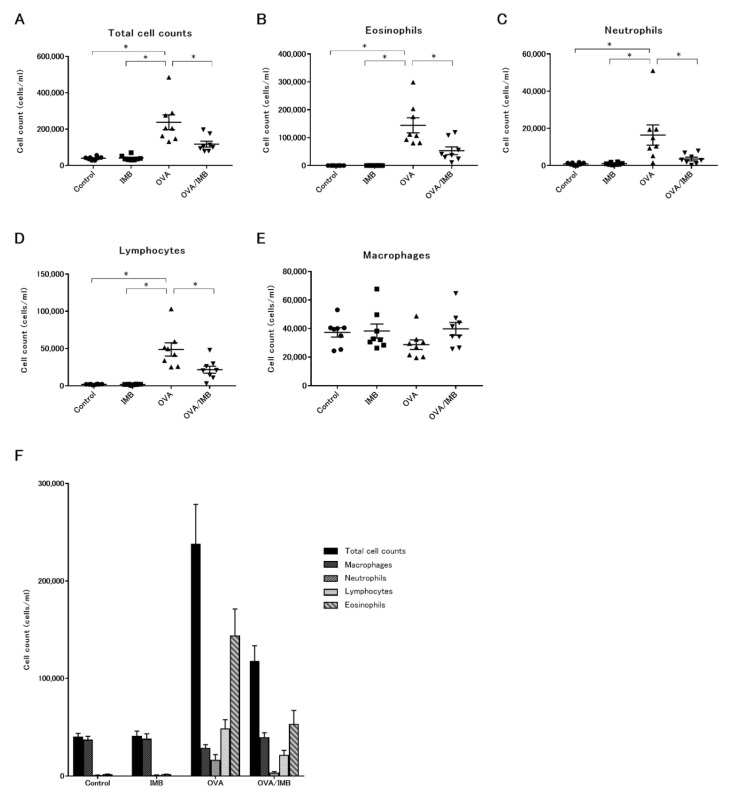
Figure 4.
The total cell count and the number of eosinophils, neutrophils, and lymphocytes in BALF were significantly lower in the OVA/IMB group than in the OVA group, whereas the number of macrophages did not decrease. The numbers of total cells (A), eosinophils (B), neutrophils (C), lymphocytes (D), and macrophages (E). The cell fractions in each group (F). Values represent the mean ± standard error of the mean. * p < 0.05.

