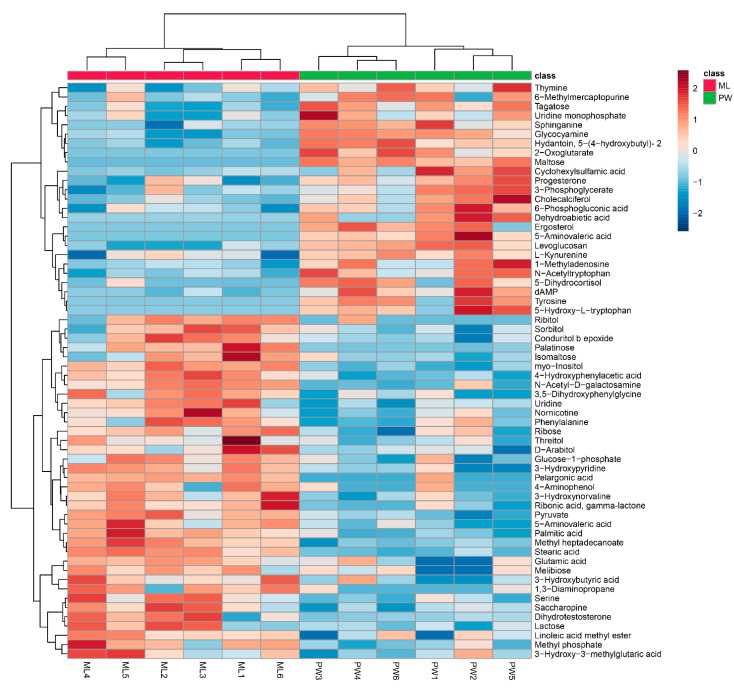
Figure 3.
Hierarchical clustering analysis for significantly differentially abundant metabolites. The relative metabolite level is depicted according to the color scale. Red and blue indicate upregulated and downregulated metabolites in termites fed a M. micrantha leaves (ML) diet relative to those fed a pinewood (PW) diet, respectively.

