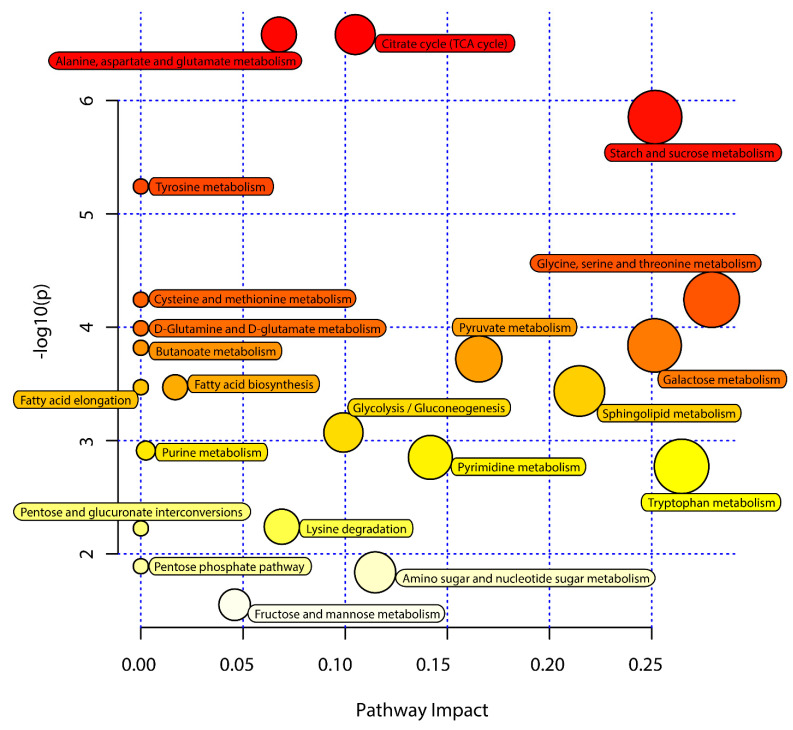
Figure 4.
Pathway analysis of the M. micrantha leaves (ML) diet and pinewood (PW) diet groups. The y-axis represents negative log(p) values from pathway enrichment analysis, the x-axis represents impact values from the pathway topology analysis. The color and size of the shapes represent the effects of the ML diet on termite metabolism relative to the PW diet; large, red shapes indicate a greater effect on the pathway.

