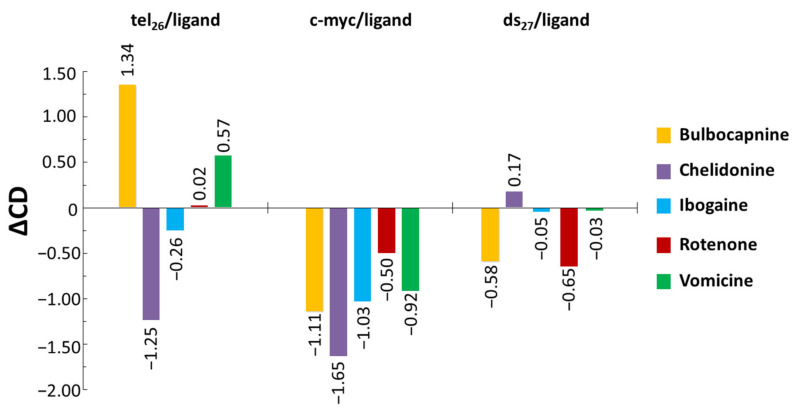
Figure 2.
Bar graph representing ΔCD values calculated as the differences between the CD intensity of DNA/ligand 1:10 ratio systems (after ligand contribution subtraction) and the CD intensity of DNA alone considering the CD values at 290, 262 and 251 nm for tel26, c-myc and ds27 systems, respectively. The errors associated with ΔCD values are within ± 0.05.

