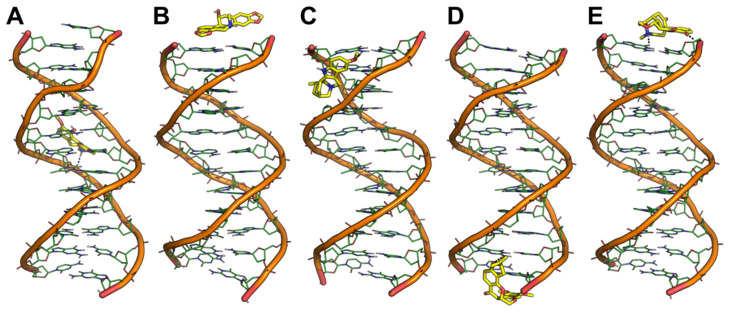
Figure 5.
Representative binding conformation of selected ligands to a DNA duplex extracted from MD trajectories. (A) duplex/Bulbocapnine; (B) duplex/Chelidonine; (C) duplex/Ibogaine; (D) duplex/Rotenone; (E) duplex/Vomicine. The DNA duplex is shown as lines and cartoon. Small molecules are shown as yellow sticks. Metal ions and water molecules have been omitted for the sake of clarity. Duplex/ligand polar interactions are highlighted by black dashed lines. The same orientation of each duplex/ligand complex is shown, which was obtained by structural alignment on the phosphate backbone.

